


This functionality is not available on our Platforms at the moment.
Sorry we couldn’t find anything

Clear Search


Clear Search
Download from the App Stores


Using Our Trading Platforms
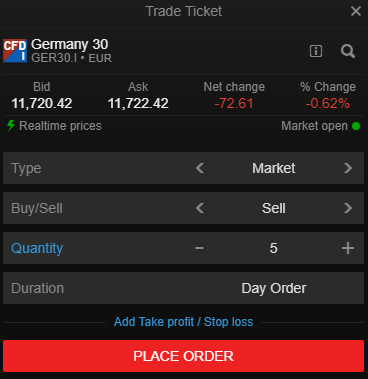
How to partially close a position?
The simplest way to close a position partially is to open a new position in an opposite direction on required quantity.
In an example below, client is holding a long position, 10 CFDs of Germany 30 and wish to reduce to 5.
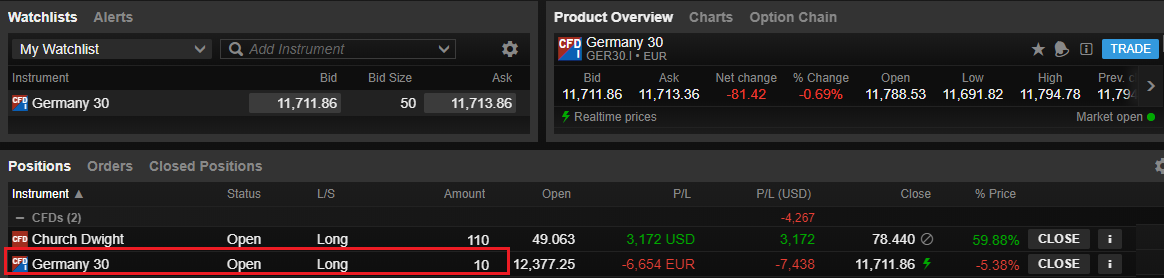
He opens a trade ticket and sells 5 CFDs of Germany 30 at market (it is also possible to choose a different order type).
Now client has only 5 CFDs of Germany 30 in his portfolio.
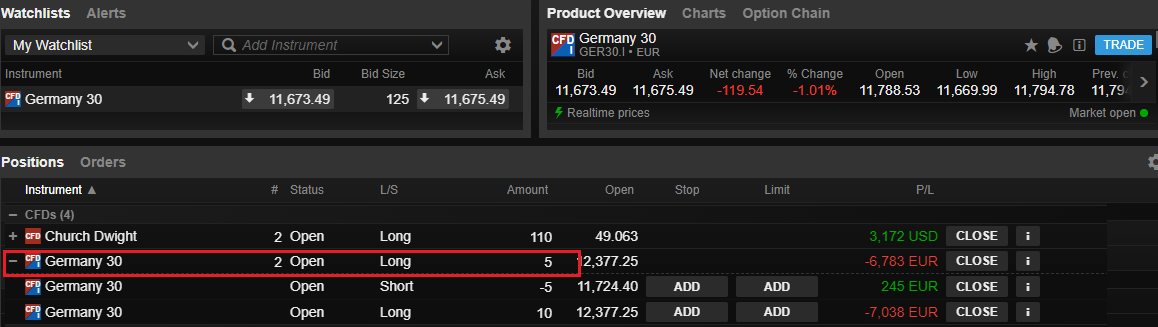
As you can see in above screenshot, both 10 CFDs long and 5 CFD short are showing in Positions module, with net long position of 5 CFDs.
Opposite positions will be net out end of the day, unless they have Related order(s) or opened from different accounts.
A module in my platform doesn't work?
If a module in the platform doesn't work, there are a few things we would like you to do, before escalating for further investigation.
For initial troubleshooting, please try to see if any of the following points resolves the issue:
In case the points listed above do not resolve the issue, please contact your account manager or email us at sales@gt.ge.
As a minimum, we need you to provide us with:
What is "Cash available"?

Cash Available is the funds available for withdrawal or for buying cash products (stocks, bonds, funds, options). It is calculated from the following components:
| Cash balance | |
| Transactions not booked | |
| Value of stocks, ETFs, bonds, funds | The value (reduced by the haircut 'Not available as margin collateral') can be used to offset components that would otherwise reduce cash available (initial margin reserved, cost to close) |
| Value of options | Negative option value reduces cash available as it is reserved for buying back the options. Positive option value can offset net margin losses, however Cash Available can never exceed initial margin available |
| P/L of margin positions | Net margin losses reduce cash available. Net profits offset components that would otherwise reduce cash available (initial margin reserved, negative value of options, cost to close) |
| Cost to close | Cost to close reduces cash available unless it is offset by positive P/L of margin positions or Value of stocks, ETFs, bonds, funds |
| Initial margin reserved | The part of initial margin reserved that is not offset by the items above reduces cash available |
Cash available is shown in Account modules and in Trade Tickets. It is calculated for Accounts, not for Account Groups or All Accounts.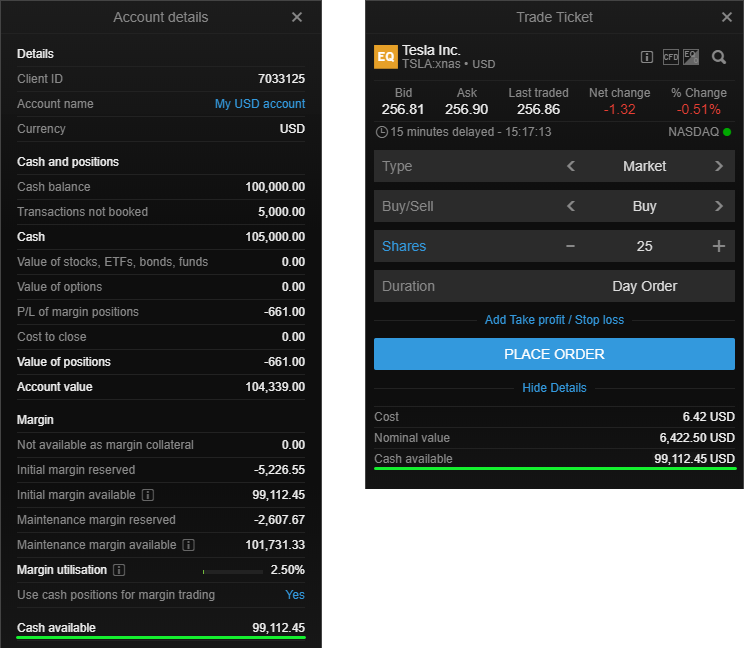
Grouped accounts
For cross-collateralized accounts, each account's Cash available considers funds spent or reserved for margin in other accounts and not covered by its cash.
Cash available for each account is calculated as the lower of:
Account level margining
Cash available is calculated separately for each account, without any spillover between accounts.
Net Free Equity
Net Free Equity amount is different from Cash available.
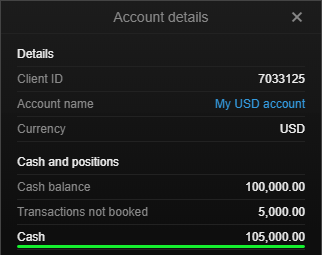
What about my total cash?
Settled plus unsettled cash are shown in Account Details, labelled as "Cash".
Examples
1. Portfolio with cash products (stocks, bonds, mutual funds)
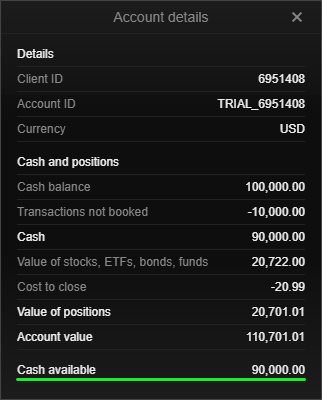
Cash available is calculated as:
2. Portfolio with margin products
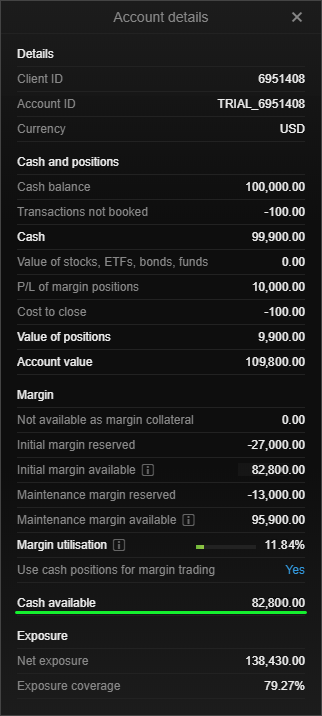
Cash available is calculated as:
For further details, consider the attached Excel file.
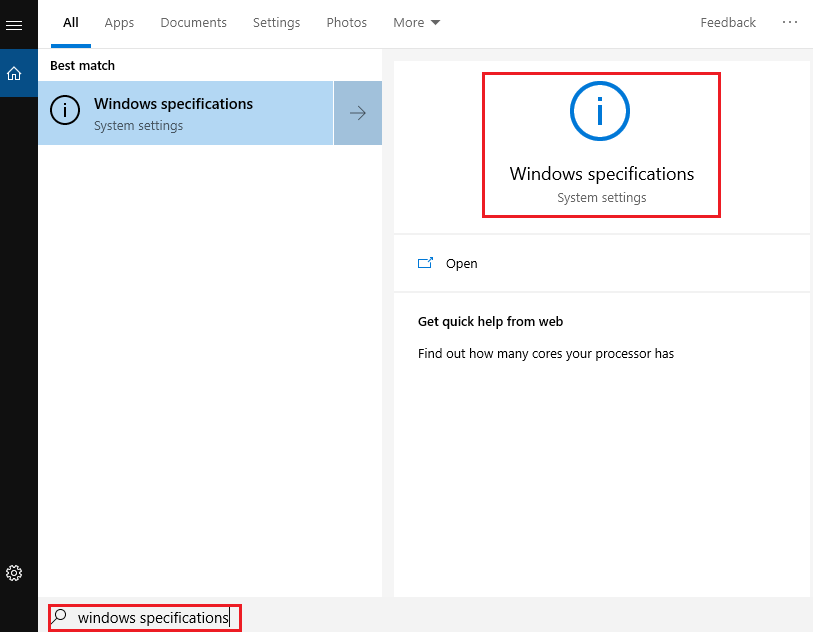
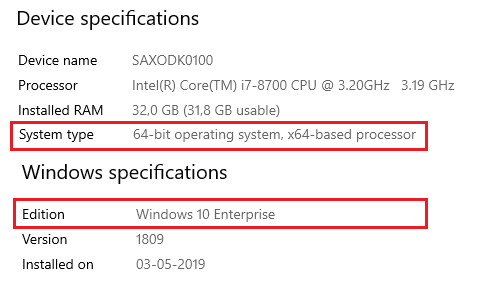
G&T TraderPro does not start on Windows
Problem description
G&T TraderPro got installed without a problem, but fails to run. When clicking on the G&T TraderPro icon, the program does not open. No error messages received.
Cause of the problem
Your hardware is not meeting the G&T TraderPro technical requirements.
As an example, you might have a 32 bit Windows, which is not supported.
You can check you Windows specifications by typing Windows specifications... or PC info... in Windows Search (see an example for Windows 10 below).
Solutions
There are some solutions provided by Microsoft to update your Windows version to 64 bit. Please check with Microsoft support online.
Alternatively, please upgrade your hardware or use G&T Trader.
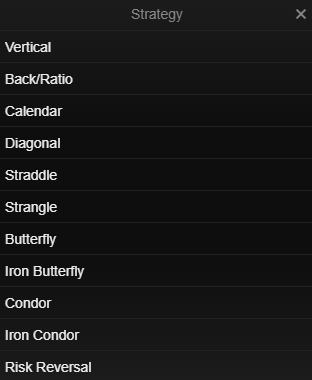
Option Strategies Ticket in G&T Trader and G&T TraderPro
The Option Strategies Ticket allows traders to simultaneously buy and/or sell different options from the same ticket. All option legs are delivered as one order and executed as one. Benefits of option strategies include reduced margin requirement and limited market risk through spread trading.
Highlights
The Option Strategies Ticket supports US Stock Options and US Index Options.
How to access Option Strategies ticket
G&T Traader: Trading > Option Chain > STRATEGIES
G&T TraaderPro: MENU > Trading > Option strategies

The Option Strategies ticket can also be launched from a watchlist - right-click on the stock and choose Option strategies. The Option Chain has been upgraded with an Option Strategies right-click menu.
Using Option Strategies
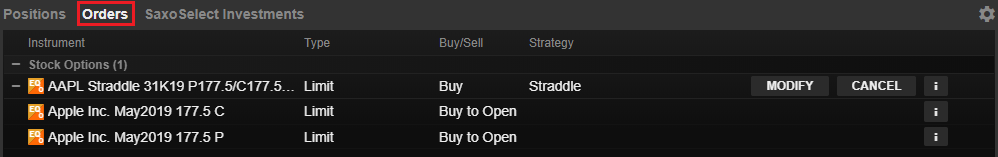
1. Launch the module and select a strategy or manually add a leg. Hit BUY/SELL button, once you satisfied with chosen criteria.
System recognizes a strategy if you build it manually, unmatched strategies are recognized as custom.
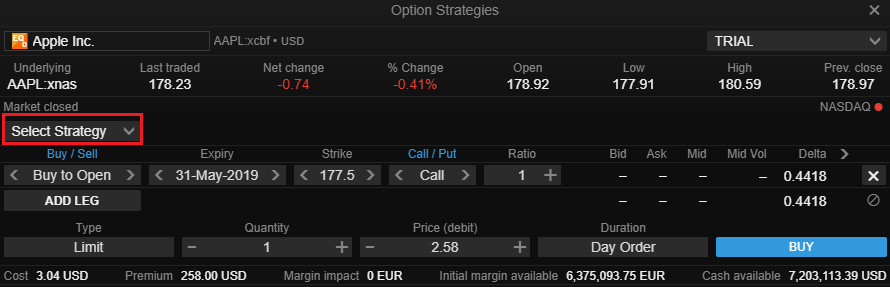
There are 11 strategies available in the ticket.
2. Confirm the order
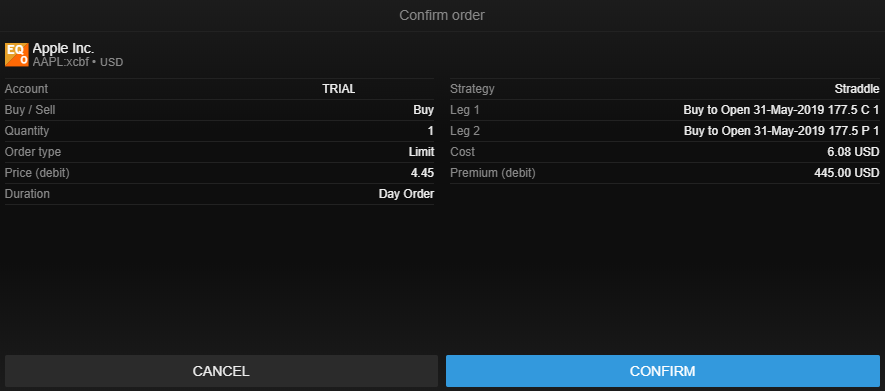
3. Pending orders are visible in the Orders module and can also be modified or cancelled. To view open positions, switch to Positions module.
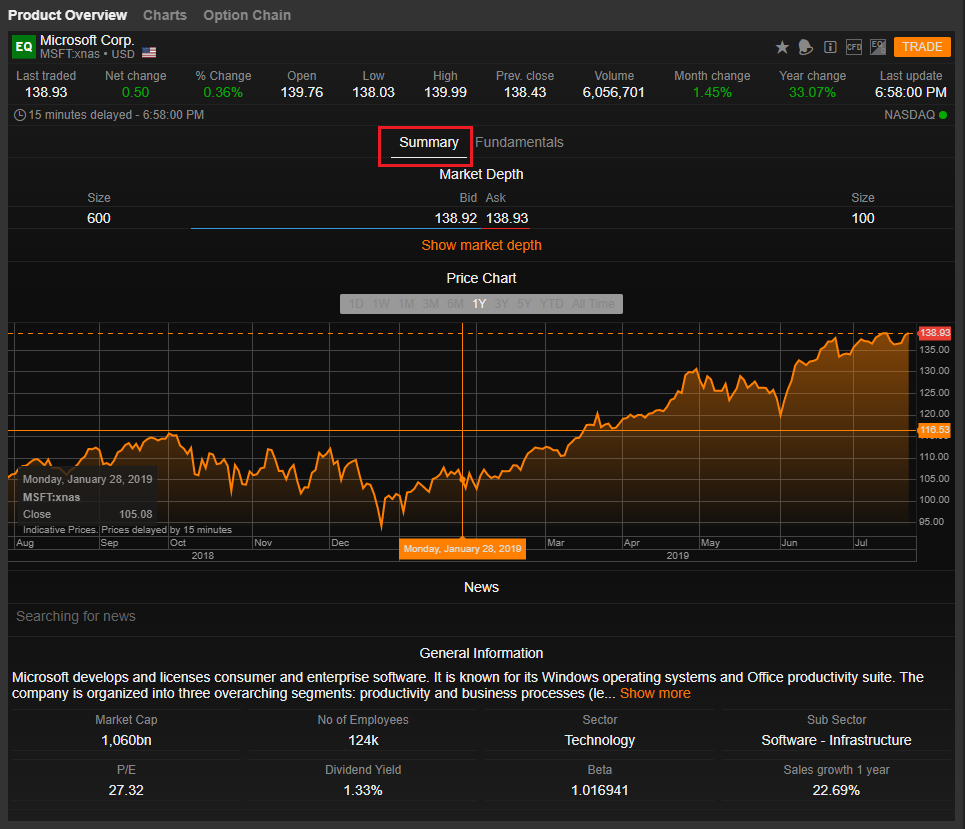
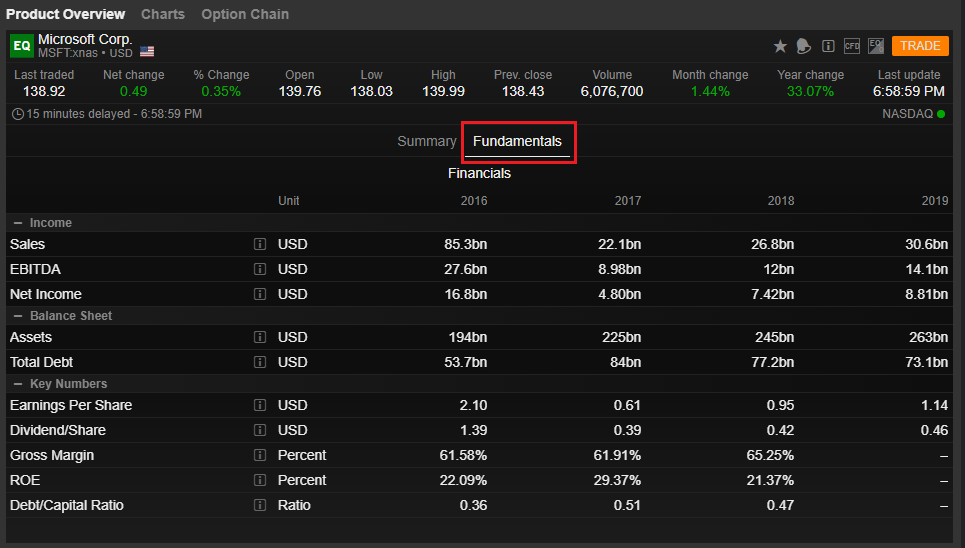
How do I get general financial information and analysis for a particular stock?
Detailed information about a particular stock can be found under Product Overview.

Switch between Summary and Fundamentals to view the company data.
Summary: General information about a company, provided by Morningstar including a Market Cap, Sector, P/E etc..
Fundamentals: Financial data provided by Morningstar (Income, Balance sheet, Key numbers)
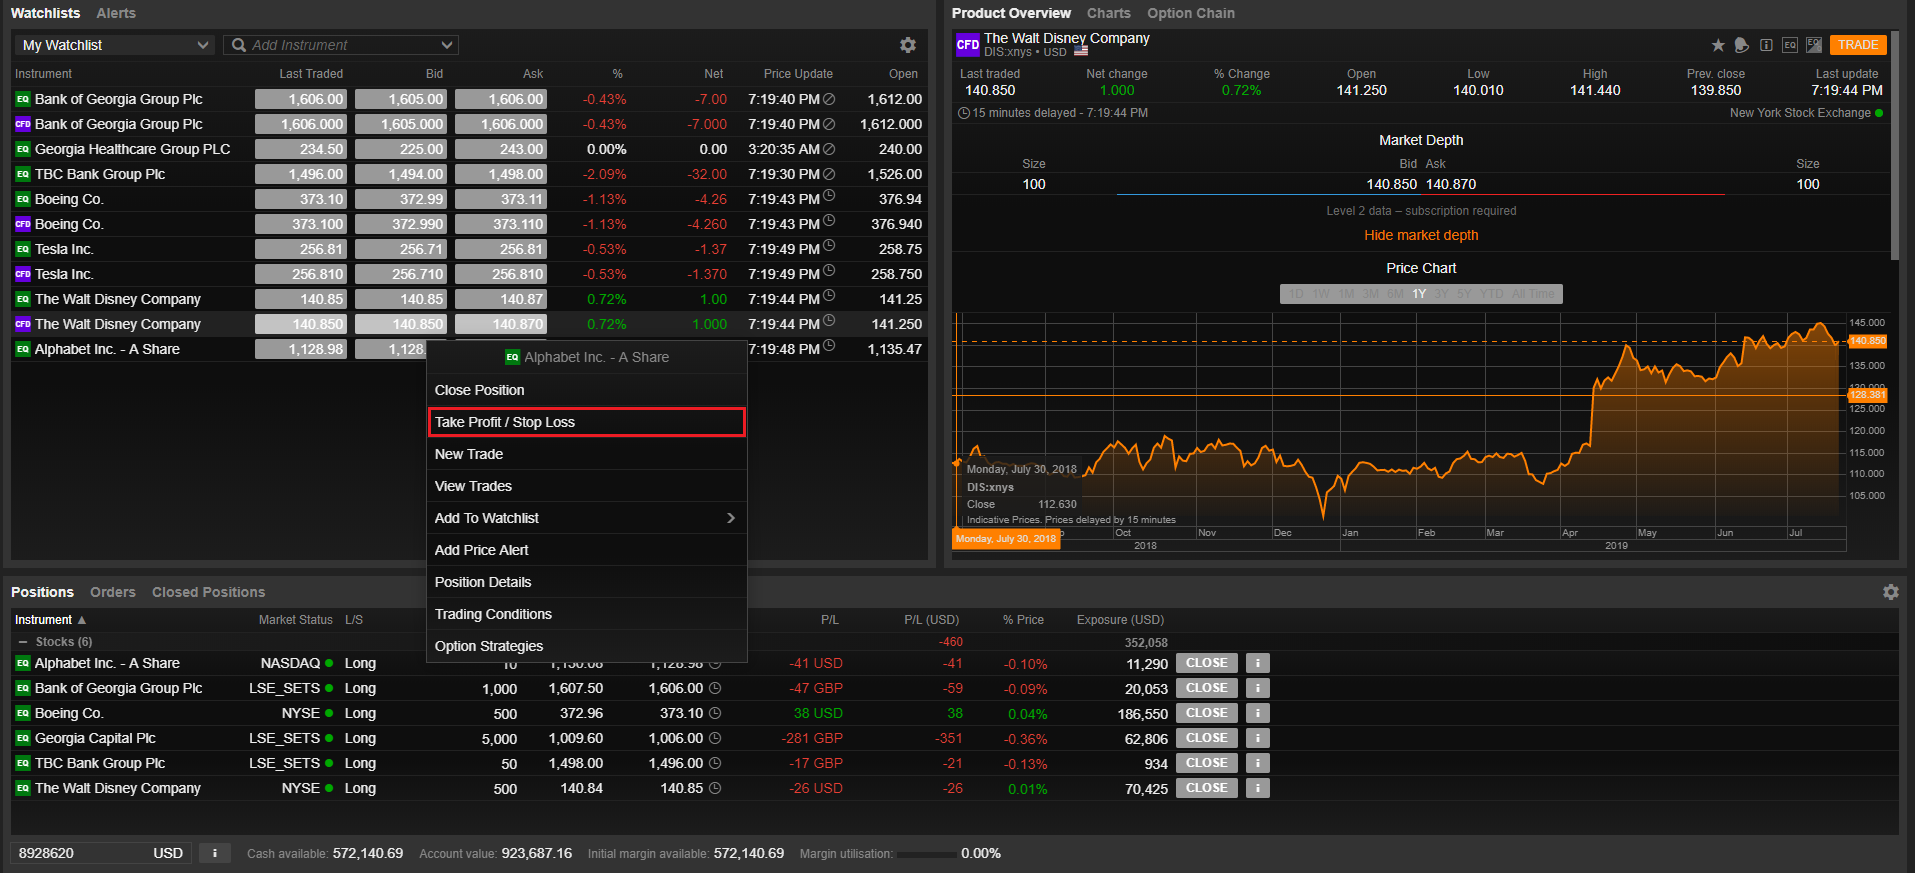
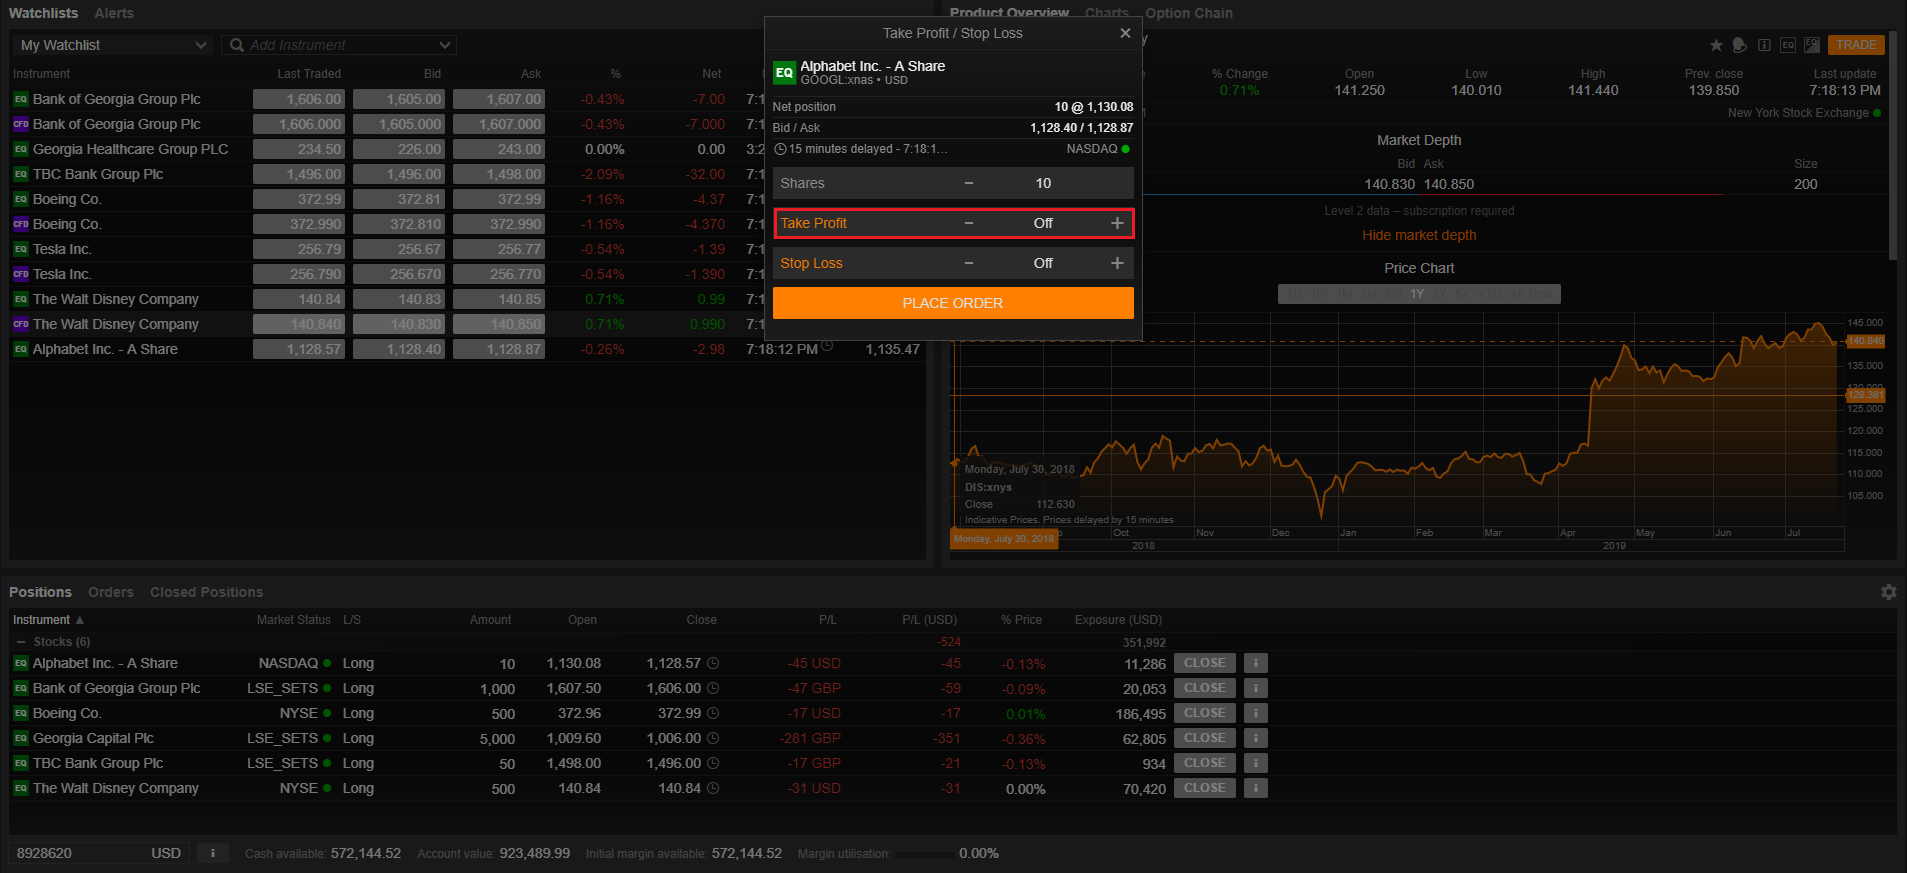
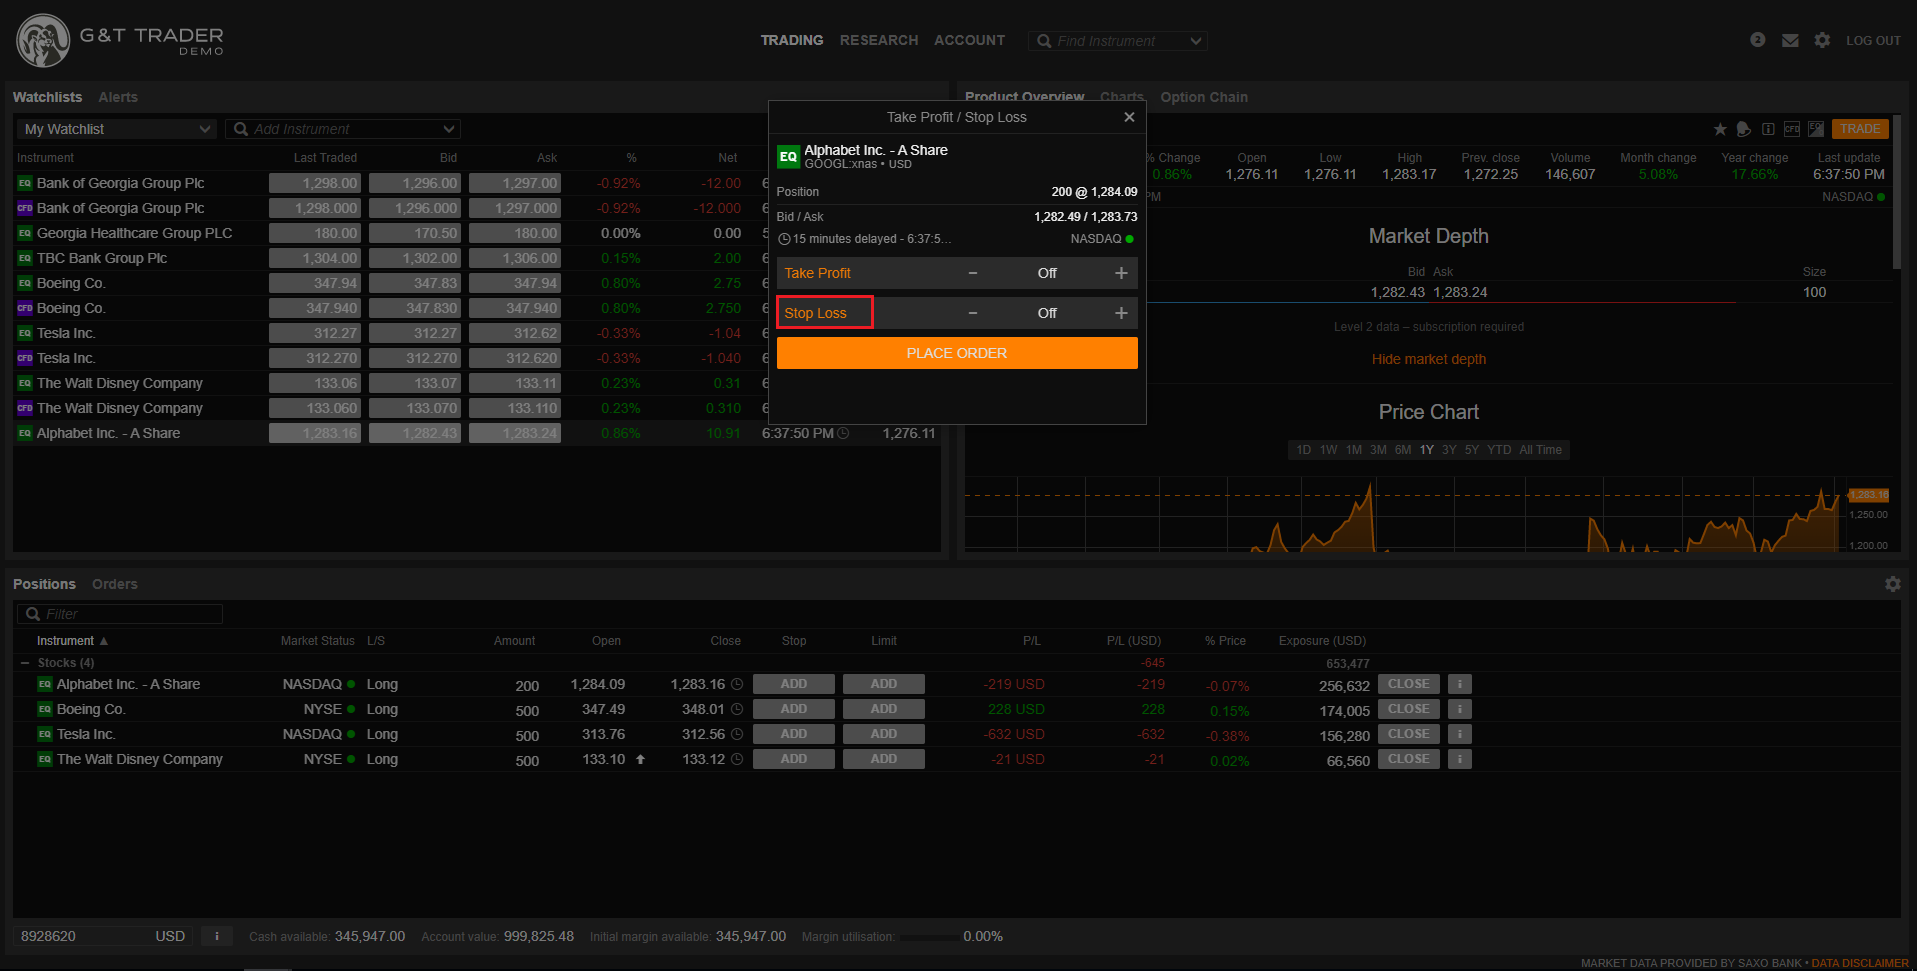
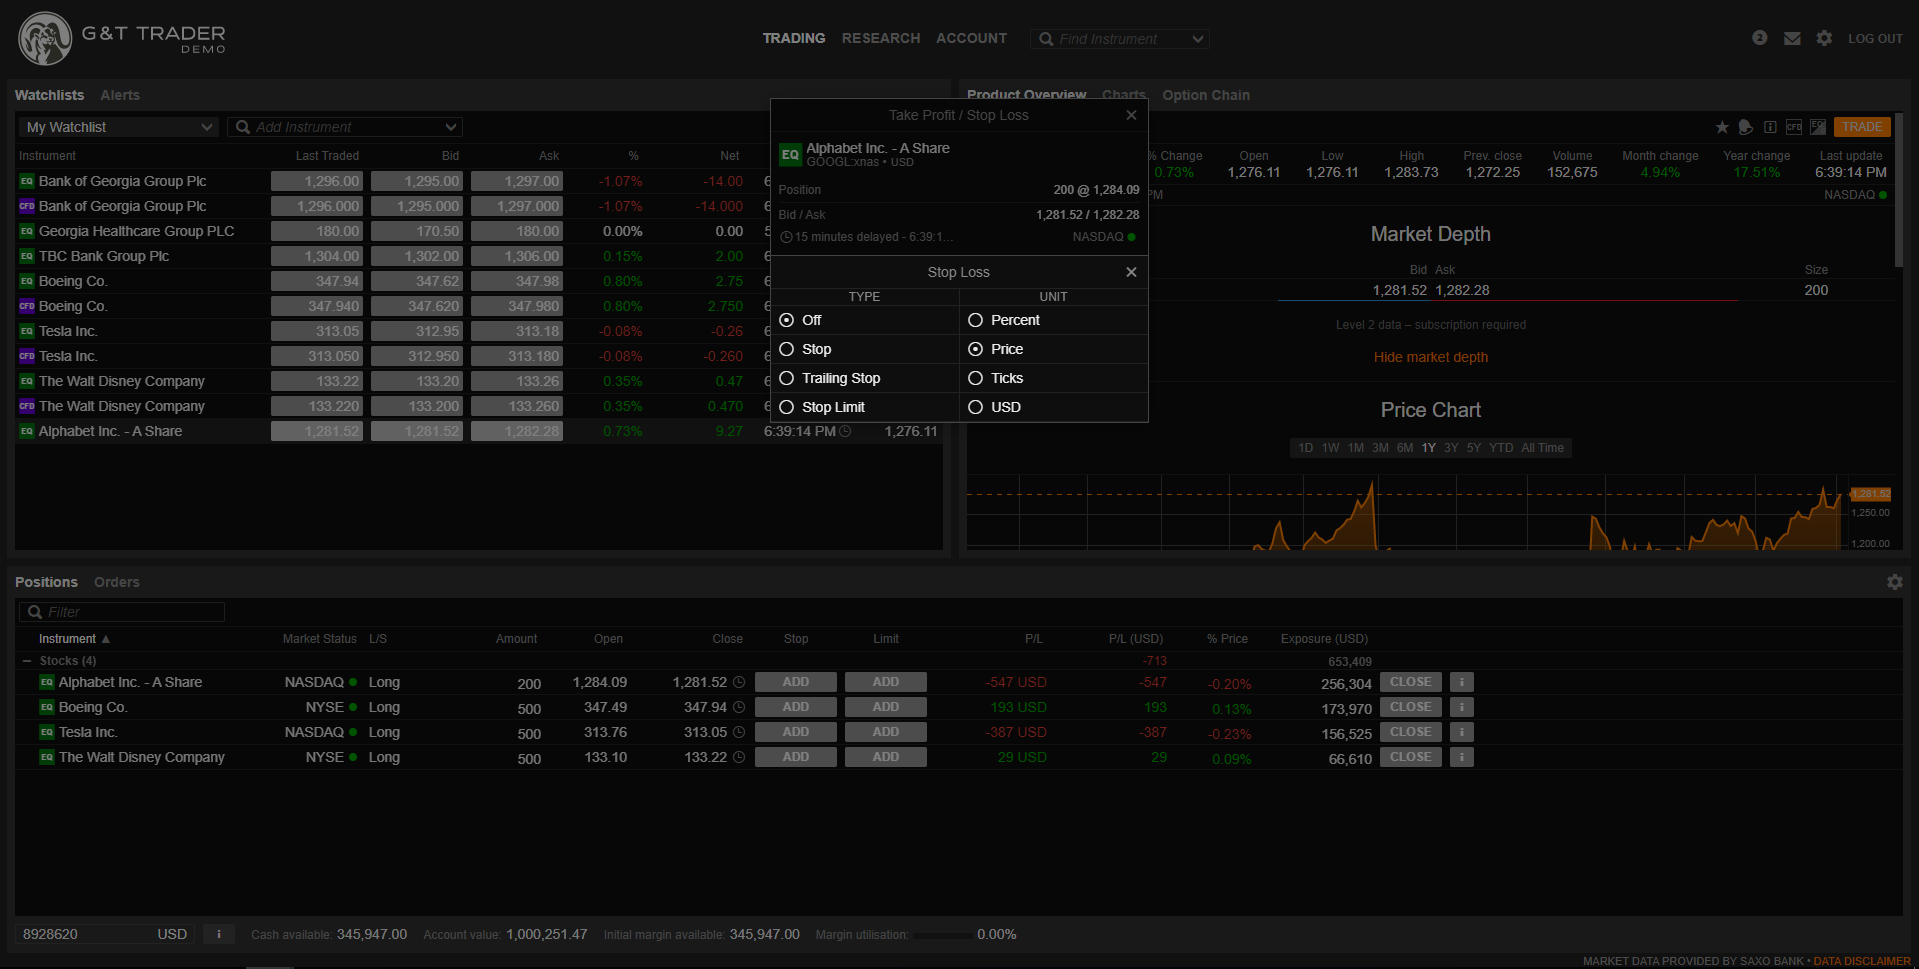
What is a stop-loss order and how can I use it?
You can use a stop-loss order to limit your losses on both long and short positions.
If the order is used on a long position, a market order to sell is triggered at a pre-defined price – and the order will be filled at the best available price in the market. Please note that execution is not guaranteed.
To set a stop-loss order, simply right-click on the position you want to place the order on. Select ‘Take Profit / Stop Loss’ from the menu, which will open a new window. In the ‘Stop Loss’ field, enter the price level for your stop (below the current price for long positions and above the current price for short positions).
What is position netting?
Netting
Netting is the process of consolidation of positions that occurs when two positions in the same instrument and on same account are in opposite direction and thus fully or partially reduces the total market exposure in the instrument. It is the process in which a buy position and sell position are matched to remove both or yield a remainder, if one is bigger than the other.
Since an account may have many positions in the same instrument opened at various times, the client may choose to close them explicitly or implicitly.
Time of netting
For clients, two netting modes are available. In both cases, final settlement still occurs at end of day, but it can be practical to only see active open positions.
End of day (Default)
With End of day netting (EOD), positions remain open and visible until the nightly end of day (EOD) settlement processing.
Real – time netting (Intraday)
The main difference with Intraday netting is that positions are netted immediately on execution. They disappear from the Positions lists, details are available as new entries in the Closed Positions list.
Enable/Disable Real Time Netting
Enable real-time netting on from Settings in any of the platforms. This is an opt-in feature (will not be enabled by default) which can be disabled by the client – thus returning to the standard EOD netting – at any time.

What is real-time position netting?
Real-Time Position Netting
Real-time Netting simplifies position management by dedicating your positions list to open positions, moving closed and partially closed positions to a new Closed Positions module.
Real-time netting uses First In, First Out (FIFO) netting – trades are closed in the order they were opened.
With real-time netting, you manage your net positions instead of individual trades. Individual trades can be seen in the new Trades dialog.
Take Profit & Stop Loss
Take profit and stop loss orders cannot be attached to individual trades. Independent take profit and stop loss orders can be placed instead (including in an OCO link) and managed separately — if you close a position, you must also cancel any previously placed orders.
That means with Real-time Netting enabled, clients cannot prevent the netting of buy and sell trades by attaching related orders. Sell trades will FIFO net with buy trades; and vice versa.
Open and Closed Margin P/L
With real-time netting enabled, Margin P/L is split into its Open and Closed components in Account Details.
Works with all instruments
Real-time netting is supported by all instruments – margin and cash-traded.
Works in all platforms
Real-time netting works in all platforms – G&T TRader (desktop, phone, tablet) and G&T TraderPro.
Enable Real Time Netting
Enable real-time netting on from Settings in any of the platforms. This is an opt-in feature (will not be enabled by default) which can be disabled by the client – thus returning to the standard EOD netting – at any time.
What is Account Value?
Account Value of your subaccount is:
Interest on subaccounts is calculated on the Account Value.
Since the Net Free Equity is calculated on open positions on all your accounts, it is important to ensure you maintain sufficient cash balance in your main account. Otherwise, you risk being subject to debit interest charges on your main account exceeding the credit interest payable on your subaccount(s).
What is Net Free Equity?
Net Free Equity (NFE) is:
Please read more below.
Cash collateral for NFE margin financing may differ from the trading margin requirement.
To avoid paying overdraft interest on your account you are required to hold sufficient cash collateral ensuring a positive Net Free Balance.
Interest is calculated daily and settled monthly - within seven business days after the end of each calendar month.
You can view the NFE details in the Account Interest Details report under Historic reports page.
One-click trading
To avoid accidental trading, by default all trades and orders placed through our platforms require two clicks.
G&T Trader and G&T TraderPro offer confirmation-free, 1-click trading when placing trades and orders.
To enable 1-click trading:
1. Click on the number “2” icon on top right hand corner on the platform.
2. A window popup for Platform Trading Setup, will allow you to select either 1-click trading or 2-click trading.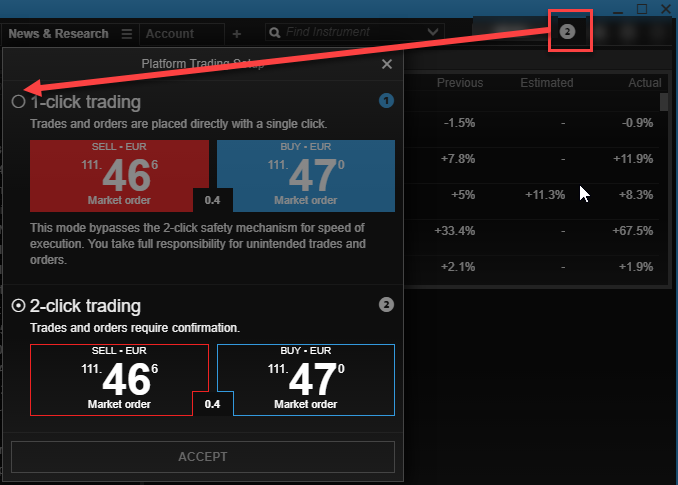
3. To confirm your selection, click on “Accept” and the new settings will be reflected.
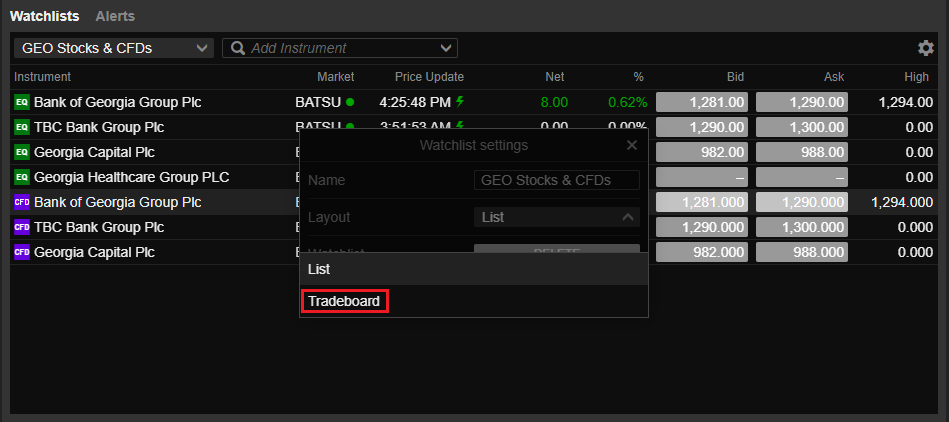
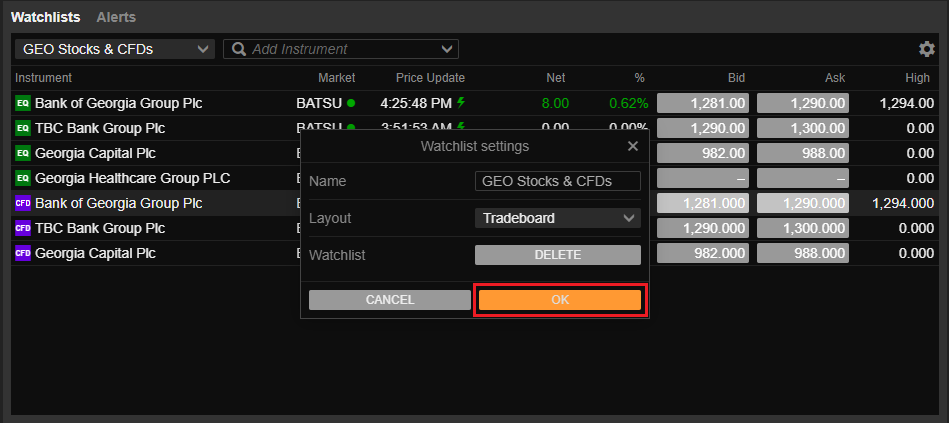
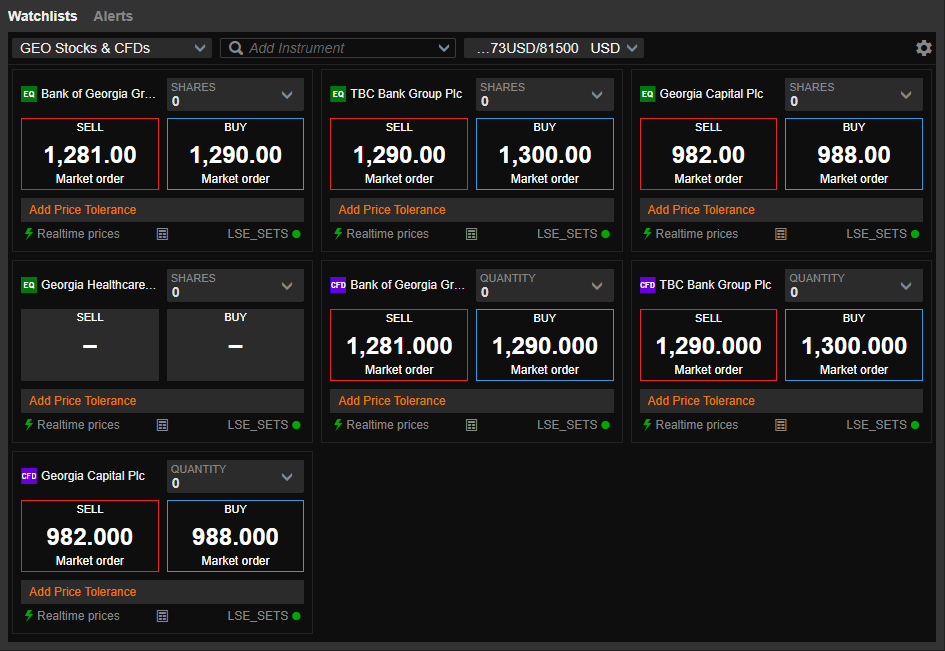
Watchlist to Trade Board view
G&T Trader offers a Watchlist and Trade Board View of the instruments in the Watchlist.
To toggle between Watchlist and Trade Board, go to the watchlist "Settings" (the gear icon), choose "Tradeboard" from the "Layout" options, and press "OK".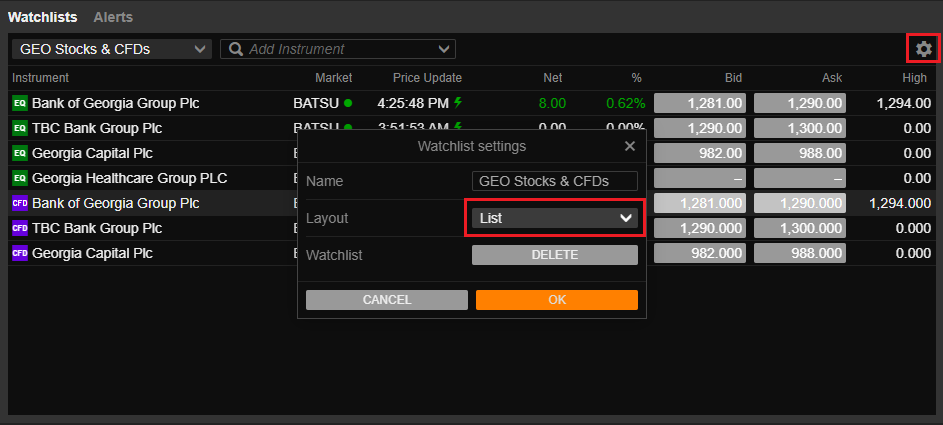
Can I trade directly from the charts?
G&T Trader and G&T TraderPro allow you to quickly and efficiently place and manage trades directly in the chart, where you can drag them to the match price levels on your chart.
How do I resize modules in G&T TraderPro?
It is possible to resize modules by dragging the border: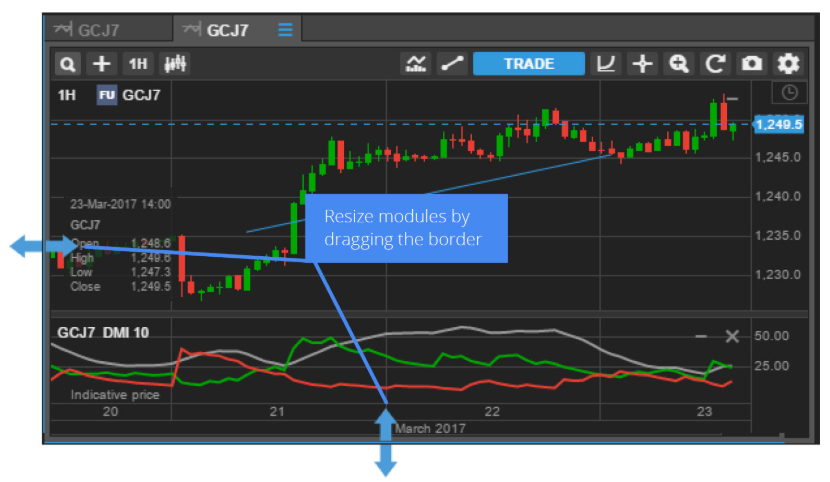
How do I add new modules in G&T TraderPro?
New modules can be added from the Menu in the platform header.
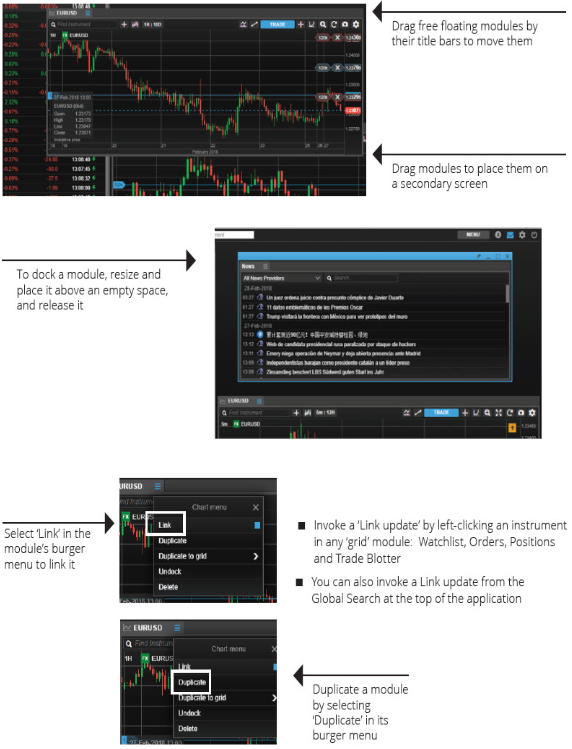
Modules launched from the menu float and can be dragged and docked into place in your workspace or moved to another screen.

How do I move modules in G&T TraderPro?
To move modules in G&T TraderPro: Click and hold the header and drag the module tab out of your workspace, or click on the small burger menu and choose “Undock”.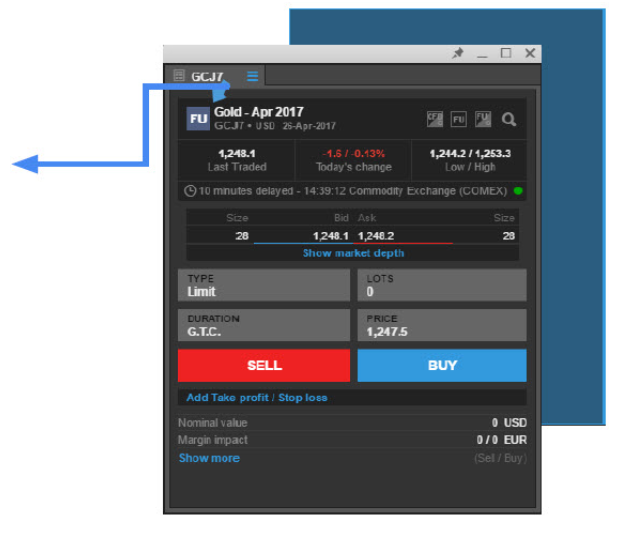
Can I upload my own custom charts to your platforms?
How do I dock modules in G&T TraderPro?
To dock to the left of another module drag the module tab and hold it still over the left side. A blue landing area will appear. Release the module and it will dock.
To dock to the bottom of another module drag the module tab and hold it still over the bottom side. A blue landing area will appear. Release the module and it will be docked.
To dock a free-floating module to your workspace click the dock icon and observe the blue landing zone. Move the mouse around and click to place it in the desired destination.

Duplicating modules in G&T TraderPro
To clone a module in G&T TraderPro, go to the menu icon in the header of the module and click duplicate. This is available on watchlists, charts, positions, and orders modules among others. This action copies the full setup of the original module.
How do I reset Workspace on G&T TraderPro?
To reset the workspace, select Settings (the gear icon) >> Platform Settings >> Workspace >> Reset.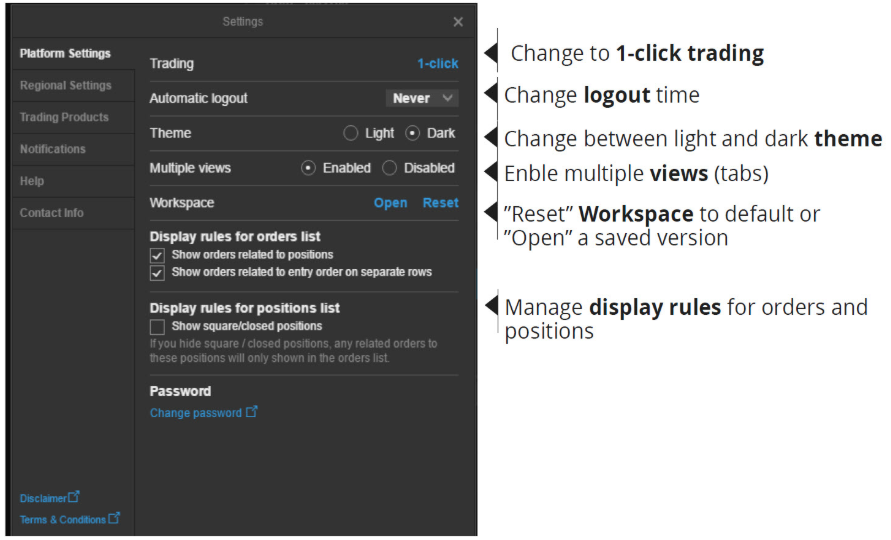
How do I turn off confirmations on G&T TraderPro?
It is not possible to turn off platform notifications. However, you can mute them for 60 minutes or group 30 notifications together – whichever comes first.
Go to "Settings" (the gear icon) >> "Notifications".
How many charts can I open in G&T TraderPro?
With G&T Trader you can display 4 charts at the same time on your computer, 2 charts if you are on a Tablet and 1 chart on your smartphone.
This image shows the Charts view on a computer, where you also can A) Get the 4 charts on full screen and B) Expand one of the charts to the whole chart area.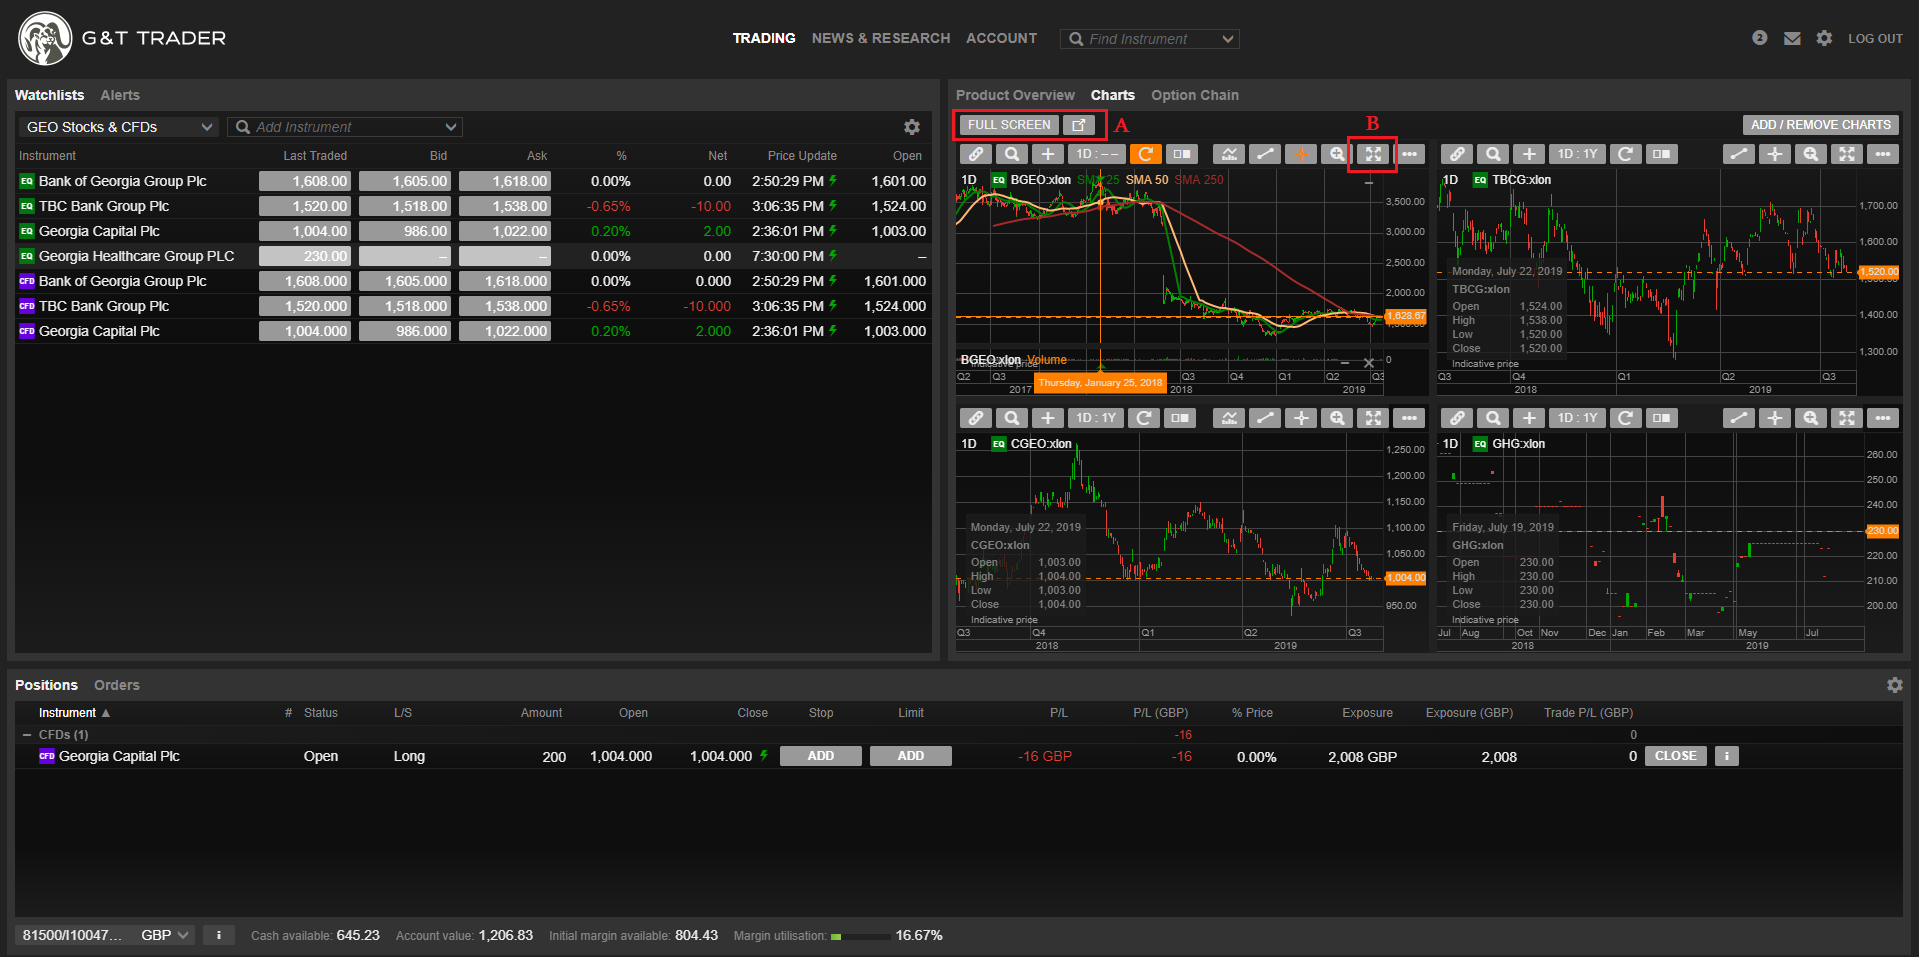
Also note that chart can be opened in a separate browser window and located on a separate screen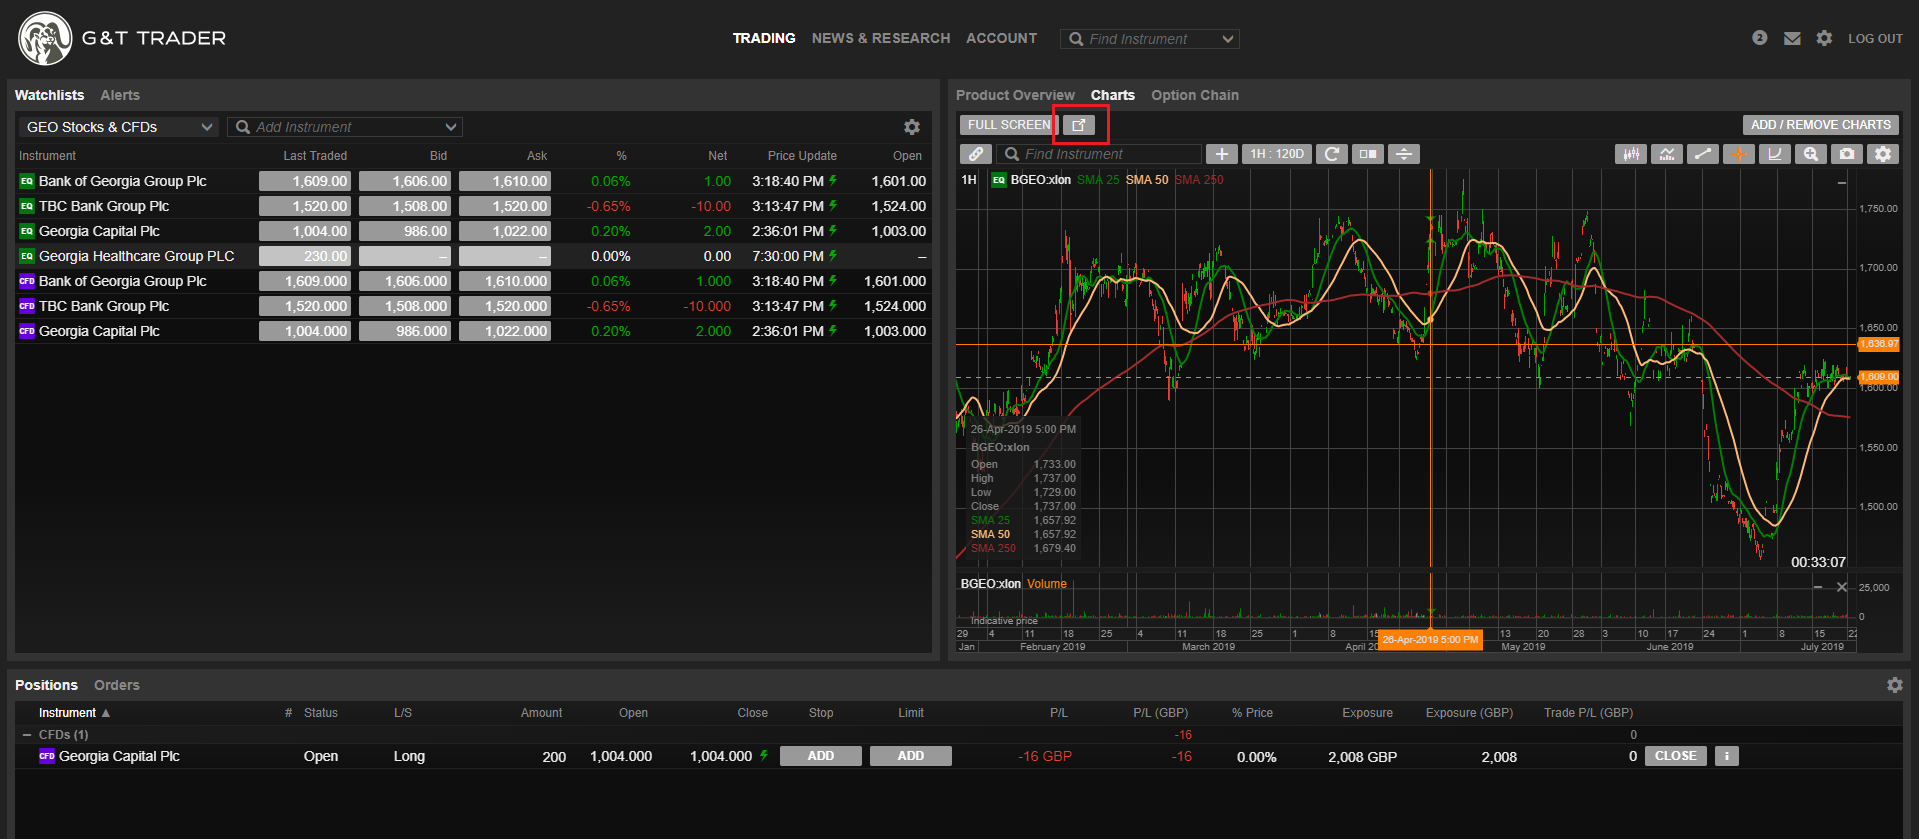
Does G&T TraderPro have to be downloaded and installed or can I run it in a browser?
G&T TraderPro is a downloadable platform and cannot be accessed through a browser. It will take up about 80mb on your hard drive when installed.
The web-based platform G&T Trader can be accessed through a browser with no download or installation necessary.
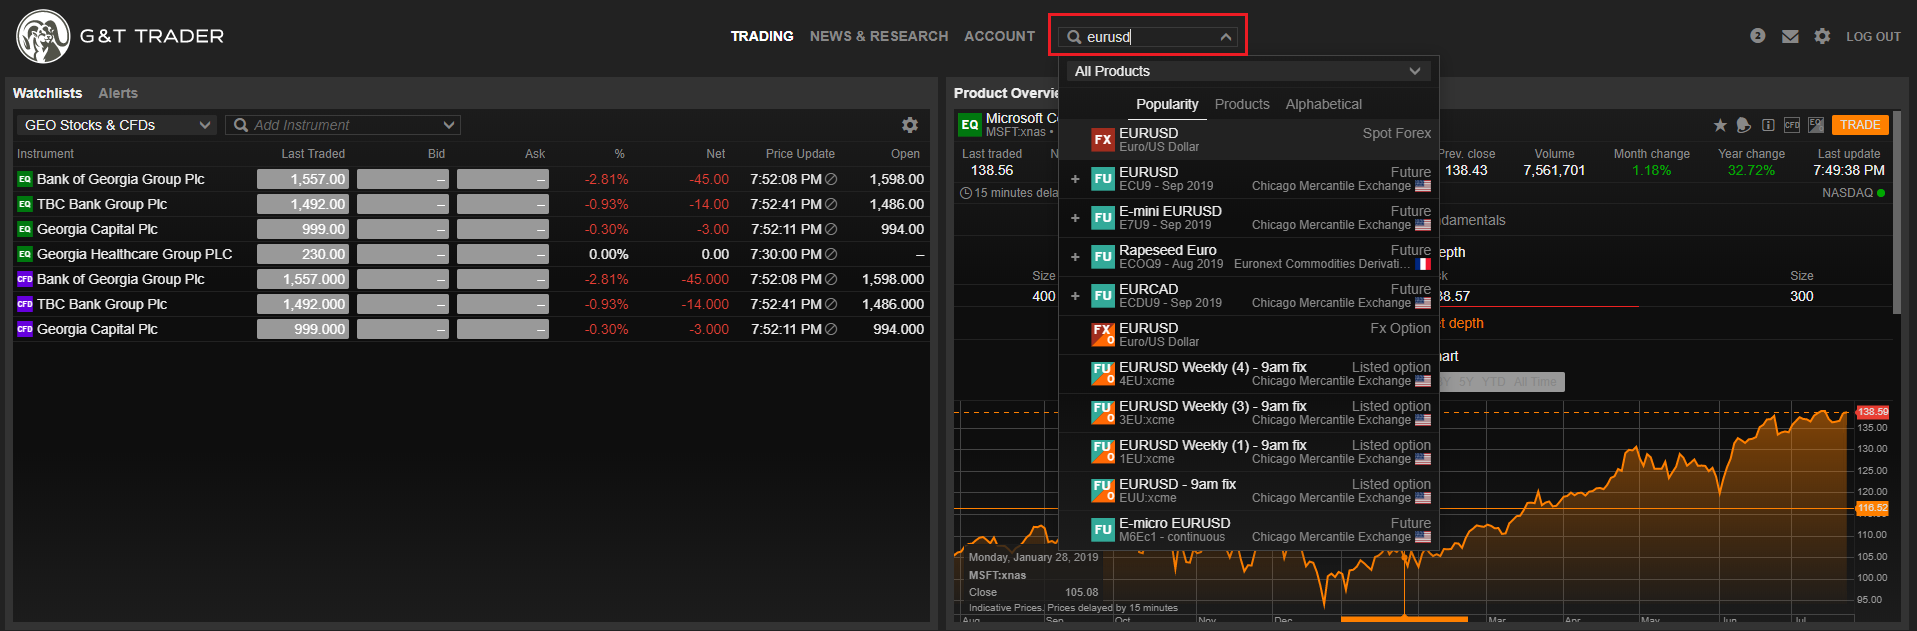
How do I find an instrument on G&T Trader?
Our platform allows you to search over 30,000 instruments by simply insert the name of the stock, FX cross or financial instrument that you are looking for.
The platform will suggest you the popular searches as the image below:
Can I save a personal workspace in G&T TraderPro?
Changes to the workspace are saved automatically.
You can also name and save workspaces manually for later use.
Once you’ve set G&T TraderPro to your preferred layout, click the gear icon in the upper righthand corner. Under Platform Settings, you will find a Save As option.
You’ll also find the Open option here, which lets you retrieve saved workspaces.
Does Galt & Taggart charge fees for their trading platforms?
Galt & Taggart does not charge any fees for using the trading platforms. There are no fees to use G&T Trader, G&T TraderPro, or the G&T Trader mobile App.
Problems with the G&T TraderPro workspace
G&T TraderPro is designed for a multi-screen desktop setup, and once configured your workspace may not fit well if you move to a single monitor laptop, for example.
We recommend using G&T Trader on single-screen setups.
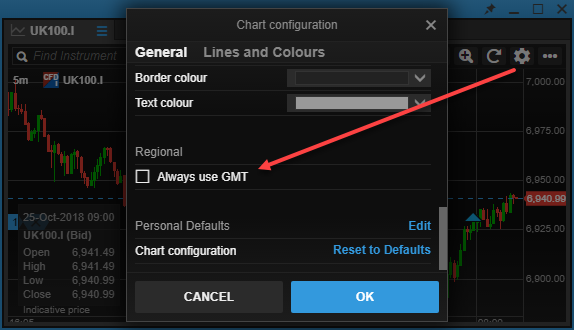
How do I adjust the time zone on a chart?
Chart time zones are synced with the platform’s regional settings. To alter this, go to Settings (the gear icon) >> Regional >> Time Zone.
You can configure charts to always use GMT. Go to the chart settings and check the box Always use GMT.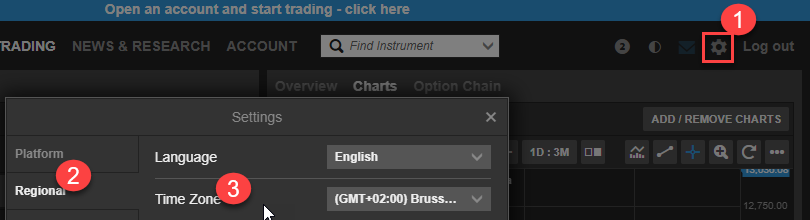
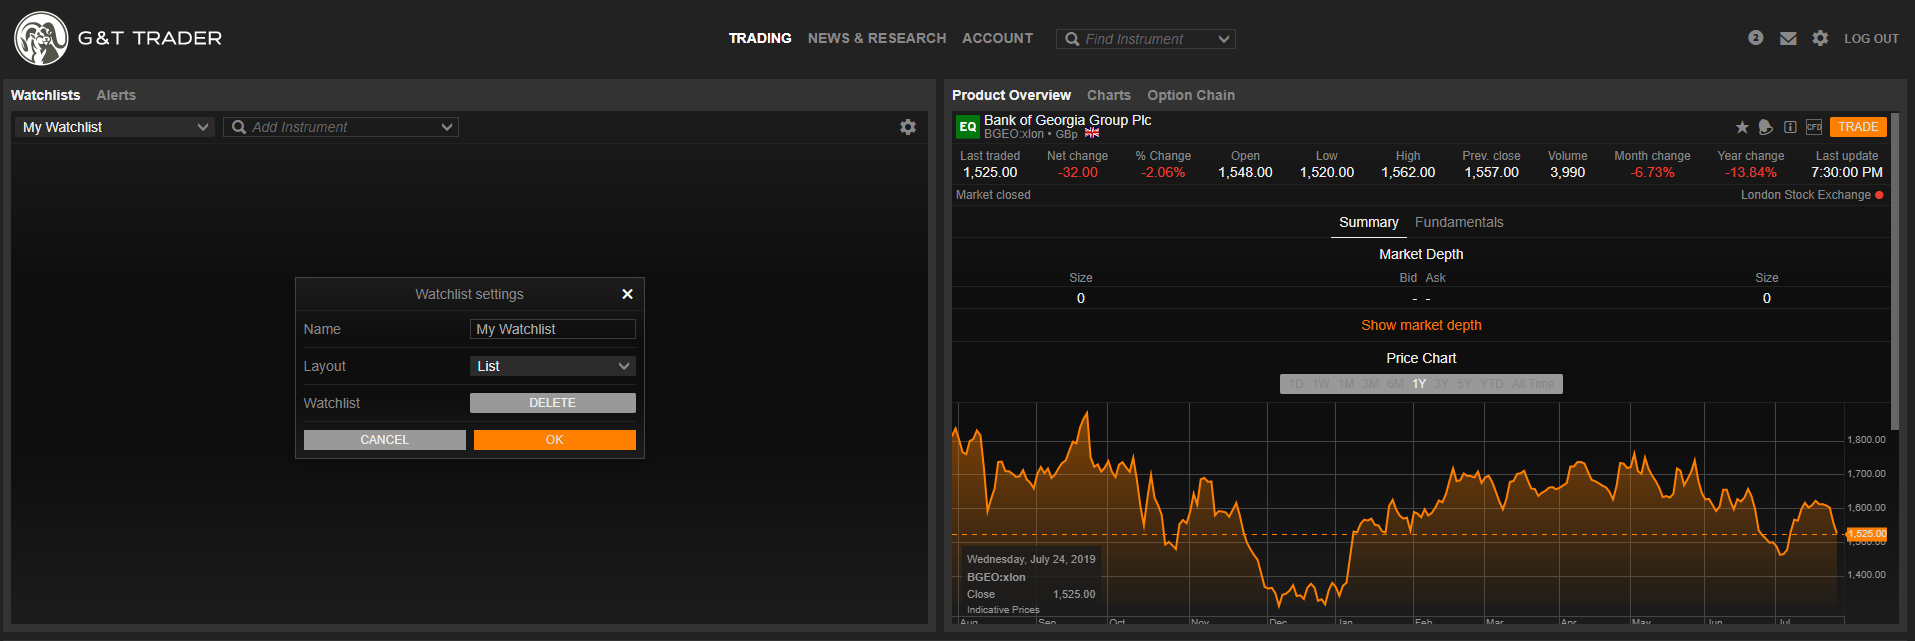
How do I create a customised watchlist in G&T Trader?
Watchlists are a great tools for maintaining a quick overview of the products you’re currently interested in. G&T Trader enables you to create custom watchlists, so that you can have a completely personalised setup.
To create a custom watchlist, navigate to the "Watchlist" section. Click on the name of the current watchlist and select the "+ New list" option. A pop-up window will open, where you’ll be able to add Instruments, rename, or modify the layout to your liking.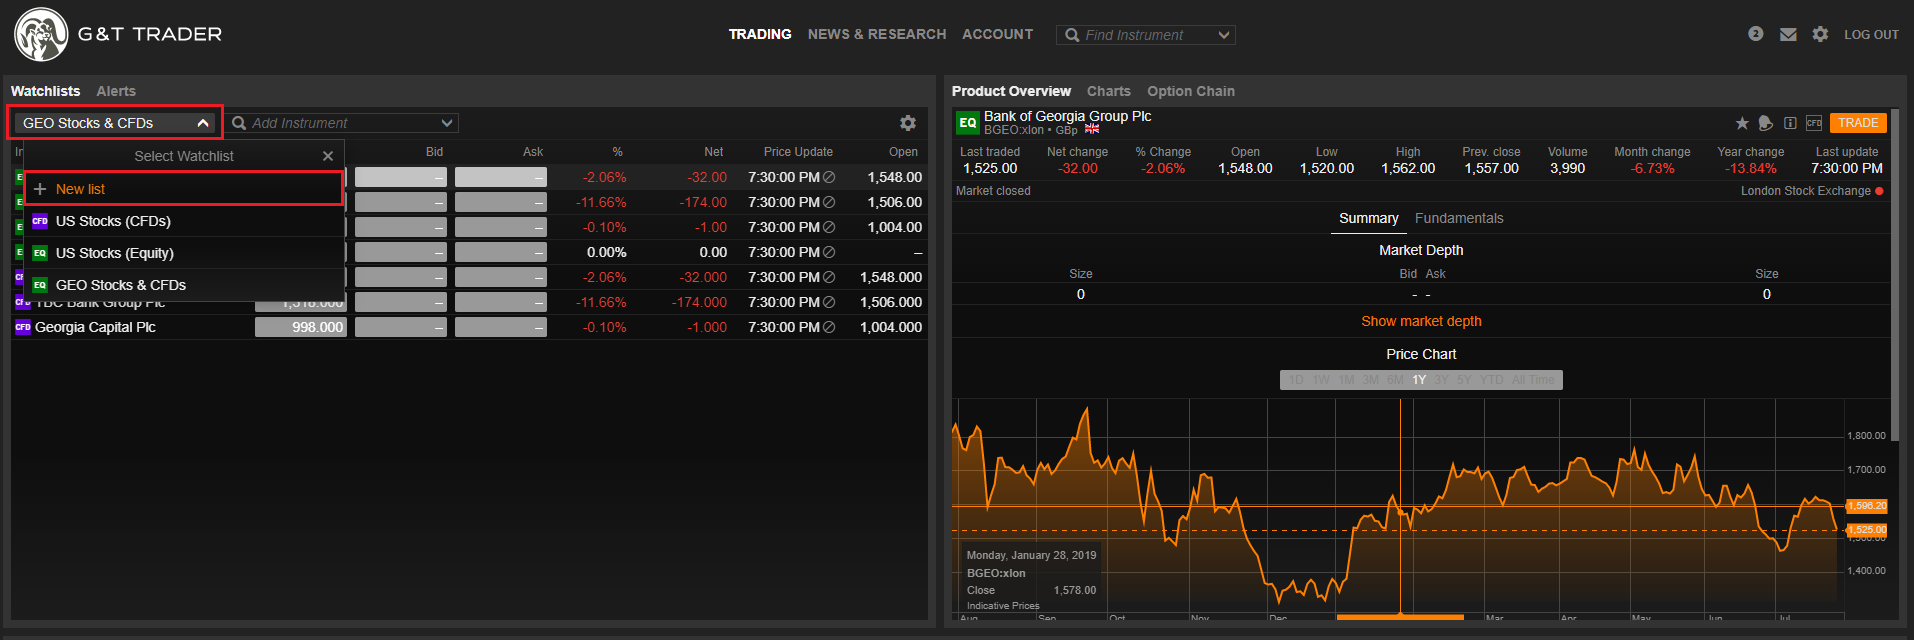
Setting up the Workspace in G&T TraderPro
Learn how to easily create your preferred workspace by adding, removing, resizing, duplicating and linking modules here: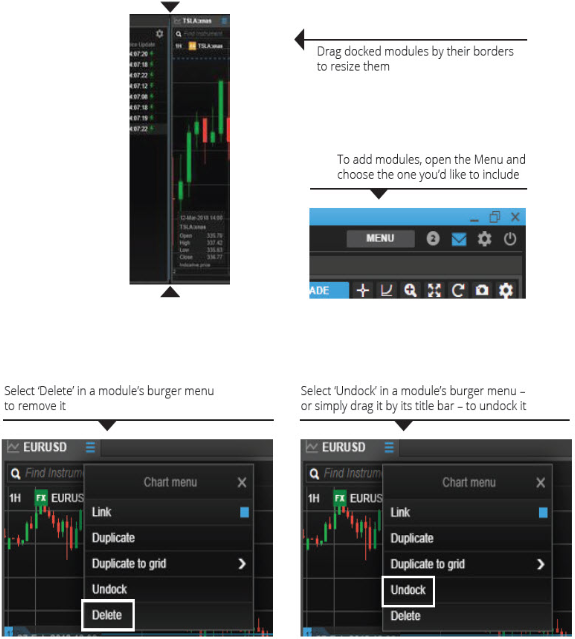
How many "View" tabs can I have and how to manage them in G&T TraderPro?
In G&T TraderPro you can create up to five new blank "Views" by adding tabs.
Saving and managing Workspaces in G&T TraderPro
Changes to the G&T TraderPro workspace are saved automatically.
You can also name and save workspaces for later use.
Open settings by selecting the gear icon in the upper righthand corner. Under Platform Settings you’ll find three options next to the Workspace area:
How to create and manage Watchlists in G&T TraderPro?
Pre-defined watchlists are available in the Watchlist dropdown. Click New List to create one from scratch. Use the Add instrument search field to add a single instrument to the newly created list.
You can add multiple instruments to a watchlist by using the pre-defined categories available in the arrow dropdown.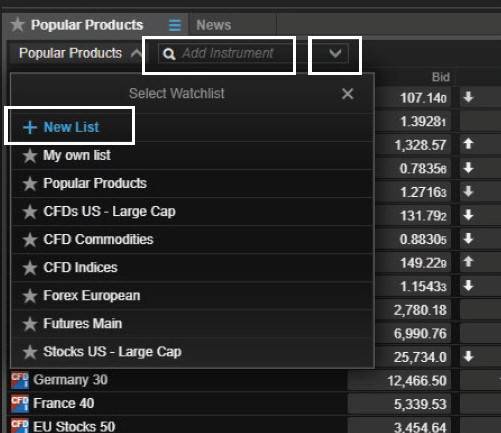
Opening one or multiple chart modules in G&T TraderPro?
Quickly create multiple charts with G&T TraderPro’s "Multiple charts" functionality.
Orders Module in G&T TraderPro
The orders module displays all open orders that are yet to be filled. Following images describe the module in G&T TraderPro.
The "Cancel All" feature in the order module lets you cancel all orders, or just those within a specific asset class, with a few clicks:
Positions Module in G&T TraderPro
The "Positions" module shows all your current positions/holdings and their P/L
Trade Blotter module in G&T TraderPro
A trade blotter is a record of trades and the details of the trades made over a period of time. G&T TraderPro has a specific module.
Trade-by-trade list, sorted by instrument, time or filtered
Account Summary in G&T TraderPro
Add the Account Summary to your workspace to see the most important information relevant to your account in real time.
From the page, you can set up an Account value shield (in below example is Off).
Click Maintenance margin reserved to see a breakdown of how margin is being utilized per instrument.
You can also set up and/or adjust Margin utilisation alert (in below example is Off).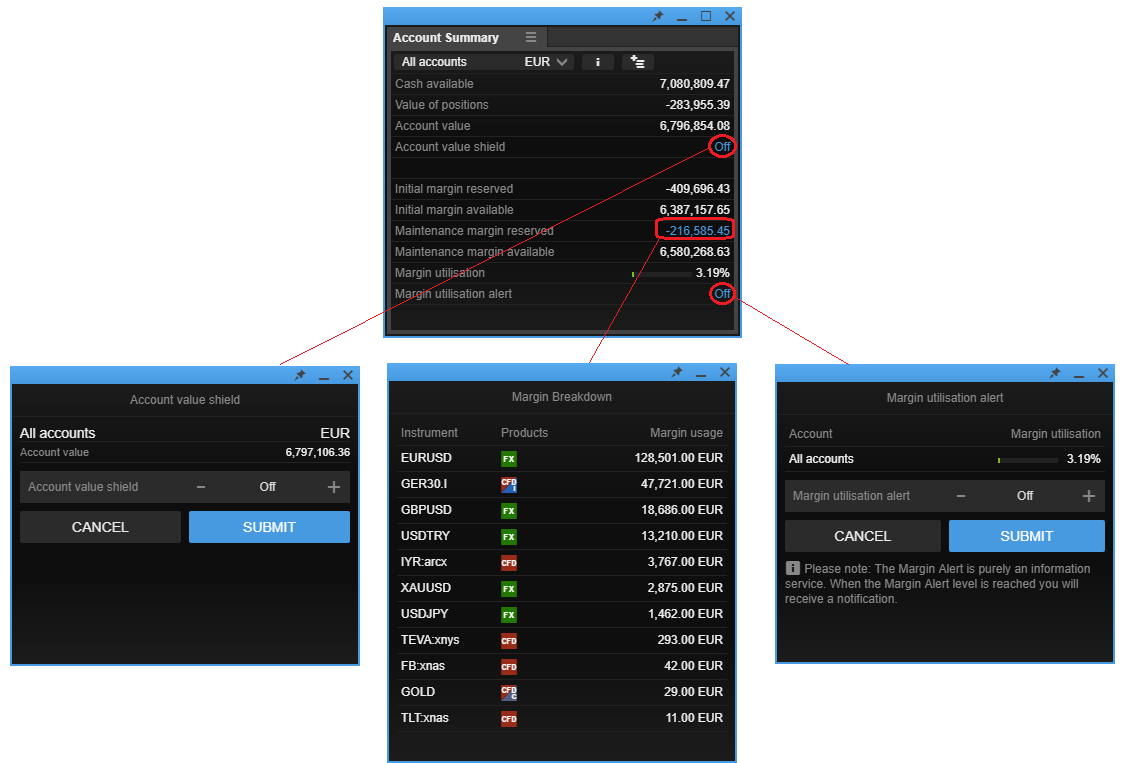
Margin utilization alerts in G&T TraderPro
You can specify a certain margin level at which a platform and mobile push notification will be triggered. Click on Margin utilisation alert on your Account Summary to add the alert.
When the specified level is reached, an alert will be shown in the platform, and if you have the G&T Trader app, you will also receive the alert as a push message.
How to increase the overall application size in G&T TraderPro?
In G&T TraderPro you can manage the overall size of the application by adjusting the zoom level.
Click the gear icon in the upper right hand corner to open Settings. In Platform Settings, you will find Zoom.
How do I unsubscribe from an exchange?
You can unsubscribe from an exchange from the trading platform.
Click the "Manage" button and then press "Unsubscribe" at the bottom of the page.
Please note that subscriptions are paid for each calendar month. Consequently, you will receive live prices from the exchange until the end of the calendar month despite unsubscribing.
Which exchange should I subscribe to?
If you wish to receive live prices for a particular instrument and need to check which exchange you should subscribe to, you can view it in both G&T Trader and G&T TraderPro platforms.
Open a Trade Ticket - see an Exchange name.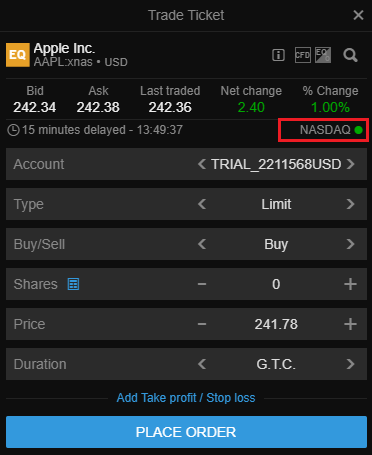
How many instruments can I have in my Watchlist?
The following limits for Watchlist maximum number of instruments apply:
It is also possible to organize your instruments in several separate Watchlists.
How do I change the chart bid/ask settings?
Galt & Taggart platforms allow you to adjust the setting of the chart to display the bid, ask or a mid price.
The charts display the bid price for OTC instruments by default. The settings can be changed to the ask/mid price by opening chart settings ![]() , Default price and choose a default price from the dropdown list.
, Default price and choose a default price from the dropdown list.
FX Options: What are the option Greeks and how can I see them in the platform?
Where can I see the updated greeks in the platform?
It is possible to see Greeks in Trade ticket details.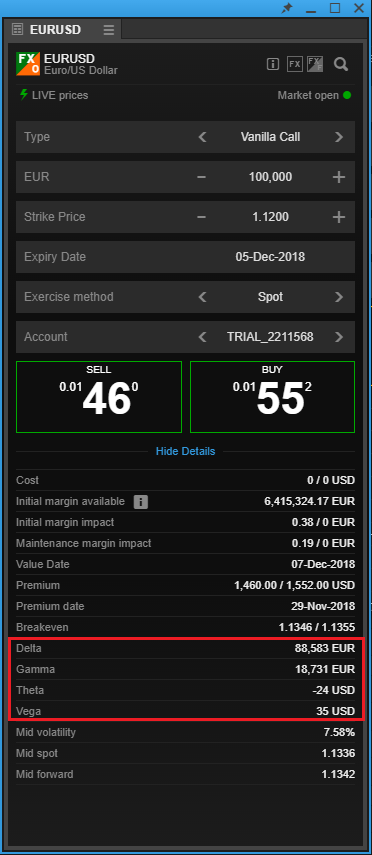
For the open position:
Click on  symbol on the position line or go to Options
  and click Greeks.
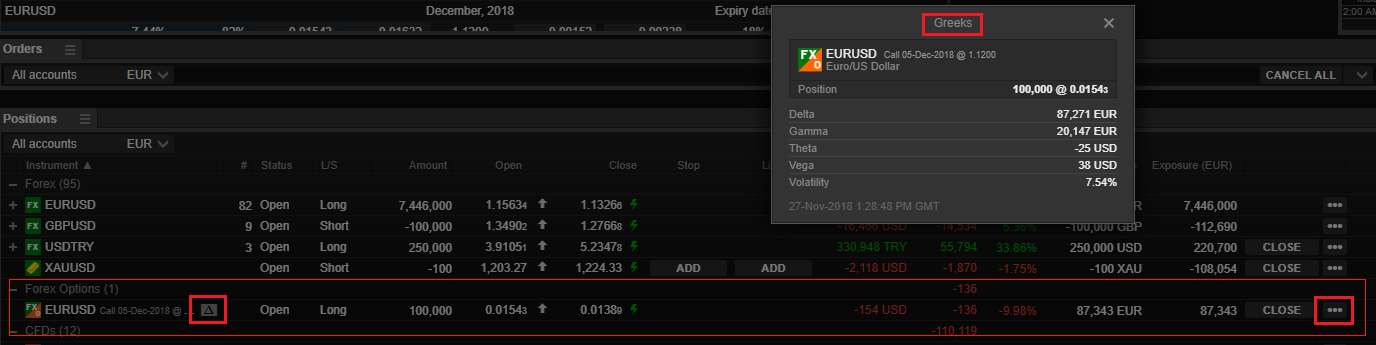
FX Options: How to find the Strike and Expiry on the FX Option Chain?
In order to facilitate the process of price discovery for FX Option traders, Galt & Taggart has developed a unique proprietary tool: the Forex Options Chain, see the below picture (image is taken from G&T TraderPro). Read more about Options Trading Conditions here.
When a trader has an idea he wants to implement, the Forex Options Chain enables him to compare the pricing of various tenors/strikes at a glance.
It is possible to view all available expiry months, by choosing All strikes in the Option Chain. Click on a plus sign  to expand.
Alternatively, there is an option to choose an expiry and a strike directly from the Trade Ticket (Trade Ticket appears if you click on a Bid/Ask button in the Option Chain).
What is a trailing stop order?
A trailing stop order can limit your losses on a position, just like a normal stop order. However, unlike a normal stop order, the trailing stop level will follow the position if it becomes increasingly profitable. You would therefore place the trailing stop below the market price on long positions and above the market price for short positions.
How to use a trailing stop
A trailing stop enables you to protect a position, without the risk of taking profits too early. If the position moves smoothly in one direction, your stop will follow it, until there is a pull-back big enough for the position to reach the stop price.
When placing a trailing stop you need to set two parameters:
To apply a trailing stop, simply right-click on your position, then select "Add" under "Stop" in your "Positions" view. Click "Stop Loss / Trailing Stop", then choose where it’s set in relation to the market price.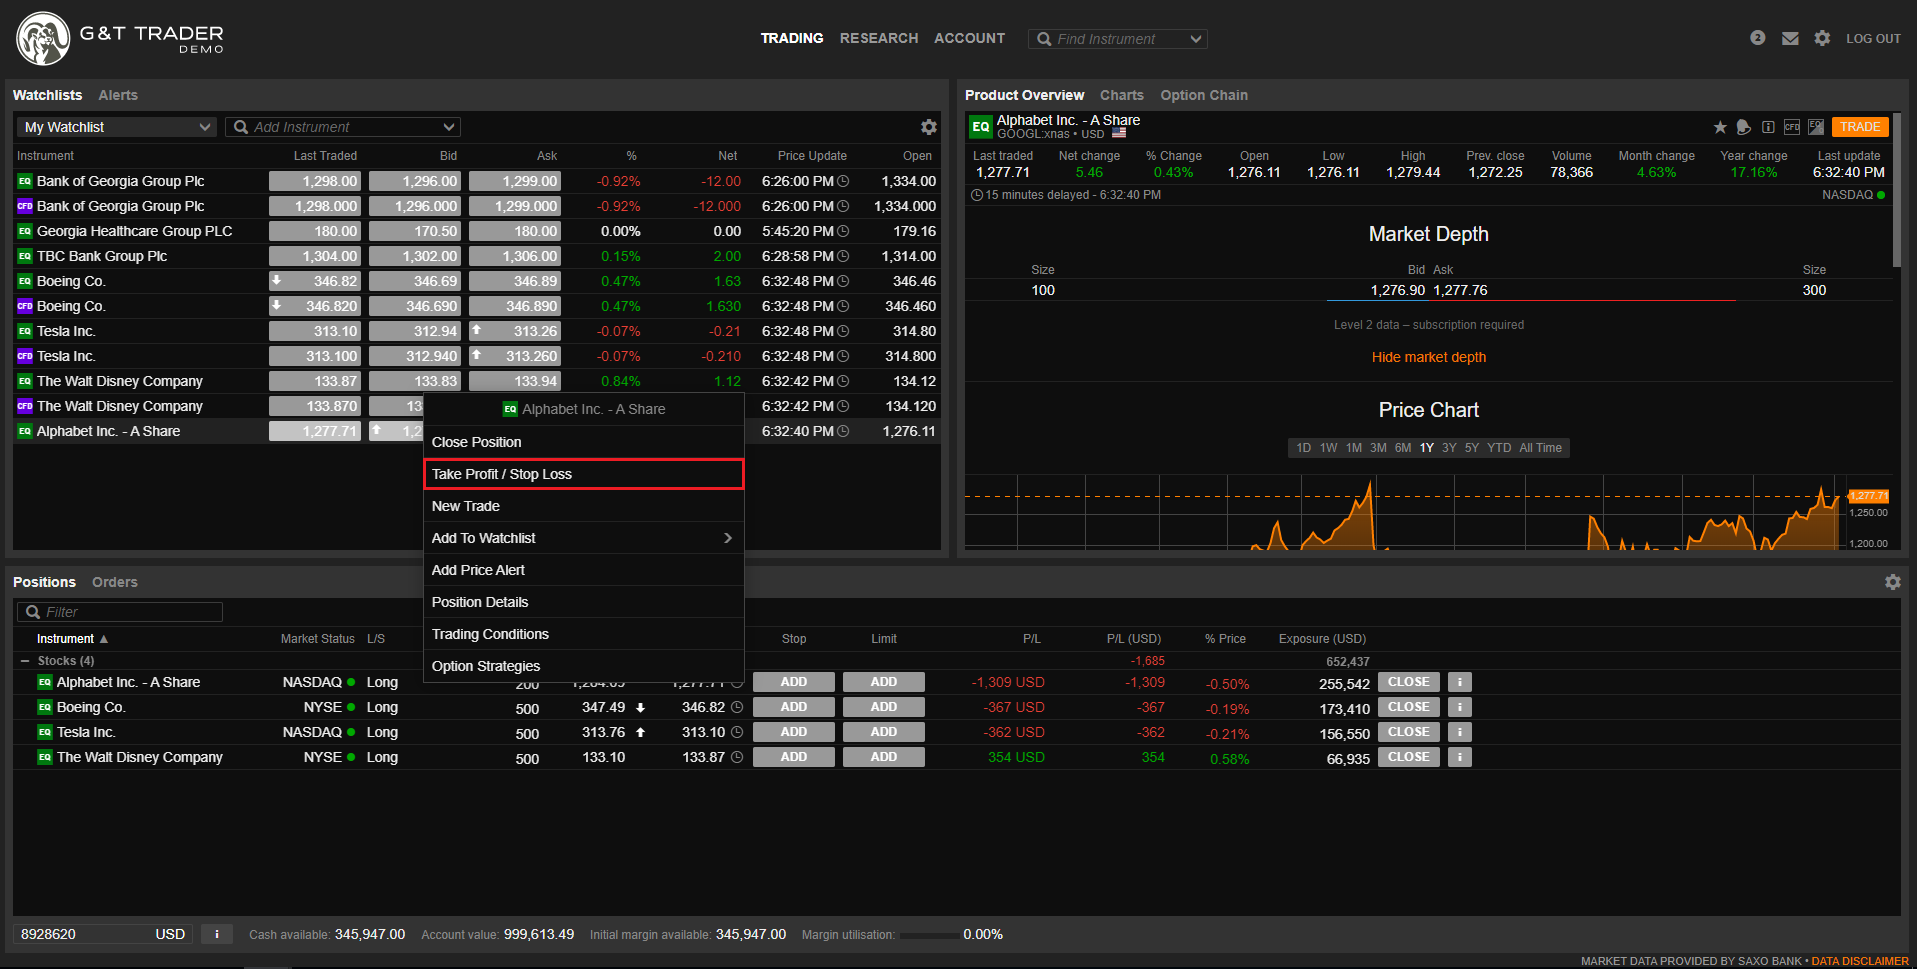
How can I use OCO (One Cancels the Other) orders?
The OCO (One Cancels the Other) order can be used to place a stop-loss and take-profit order on a net position as well as to enter the market. Stop and limit orders, placed on individual position have OCO relation by default.
OCO orders that are not related to a position can be used to place a stop-loss and take-profit order on a net position, where one is cancelled if the other is executed (also known as "bracket orders"). This useful for example when you have traded in and out in an instrument during the day, and want to protect your net position overnight.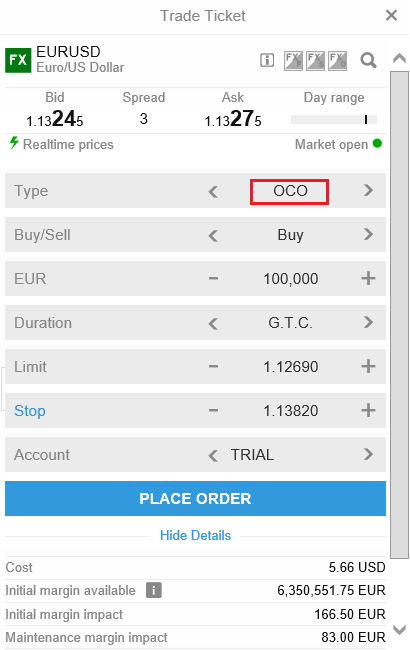
If you do not see OCO order type, please enable it by going to Advanced Orders (click on Type field and switch to Use Advanced Orders).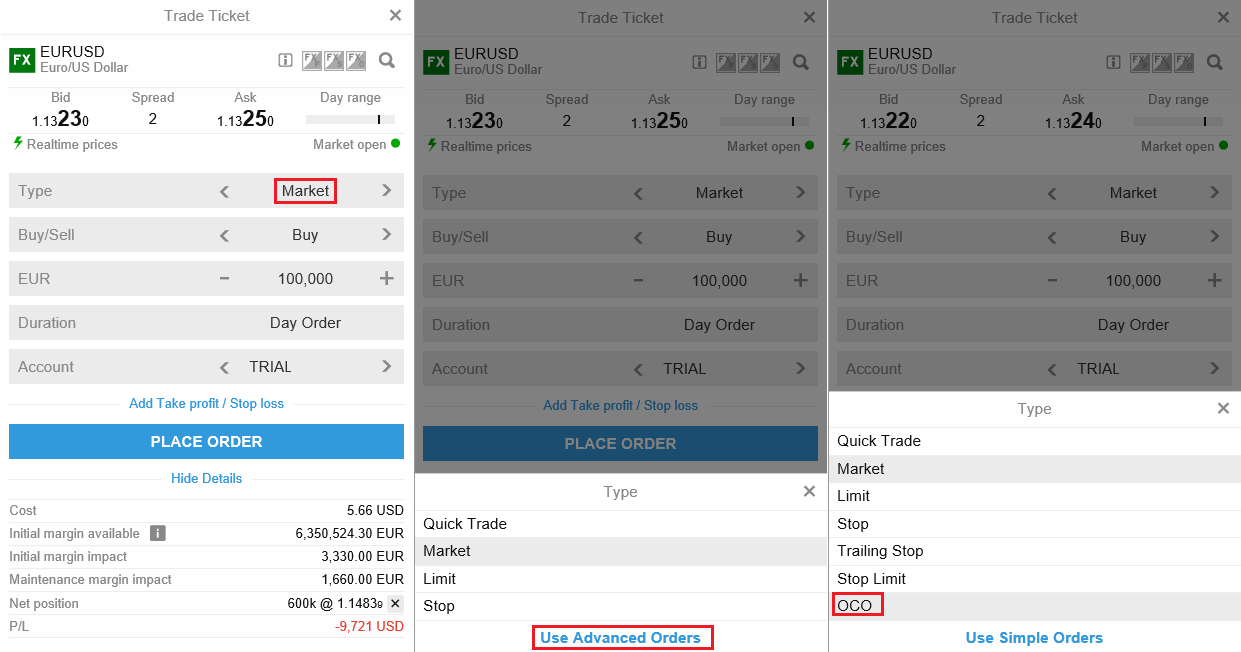
How can I change a language in my platform?
The language settings in G&T Trader and G&T TraderPro platforms can be changed by going to Settings >> Regional.
AEX Index Daily Options - how do I find the expiry?
There are 3 option types available for AEX Index: daily, weekly and monthly
That gives you a wide range of active expiries on any given day, for example on a Monday, you will be able to trade one of the two active daily options, either one expiring the same day or the next day, Tuesday. Also, you could trade one of the weekly options or the monthly option for an expiry on any Friday during the month. On a Thursday, you would only have one daily option available: the one expiring on the same day, Thursday. This is because the "Friday"-expiry is covered by the Weekly option. If the Friday happens to be the third Friday in the month, also you will not find a weekly option available for that - because that expiry date is covered by the monthly option.
Trading Conditions on particular option can be found in Trading Conditions module:

What is the security level when I log in to my account?
With Galt & Taggart, you only need one G&T ID and password to access all our products including G&T Trader, G&T TraderPro, and G&T Select.
Galt & Taggart applies the highest industry standard for data protection to all our products and platforms.
All client data is encrypted by a 2048 bits asymmetric key algorithm ensuring safety of your personal information.
How to roll over Futures positions with spreads?
It is possible to roll your expiring Futures position to a next month by closing your existing position and open a new one, using a trade ticket. Alternatively, the same can be done by using Futures spread.
See below example from G&T Trader:
Go to Trading >> Find instrument >> click on Futures Spread icon  after finding a contract you want.
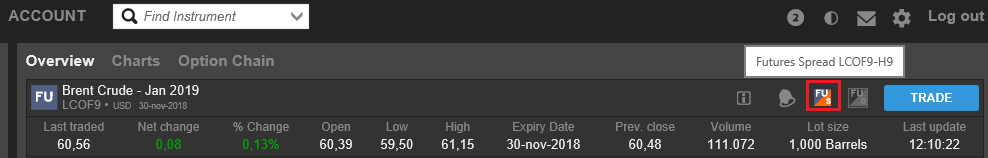
Choose order type, buy/sell, amount and duration. Check buy/sell legs and trade details before placing an order.
In below example when executing a Buy order, Brent Crude - Jan 2019 will be bought and Brent Crude - Mar 2019 will be sold.
Above scenario suits clients who are rolling their Brent Crude - Jan 2019 short position - they become short next month.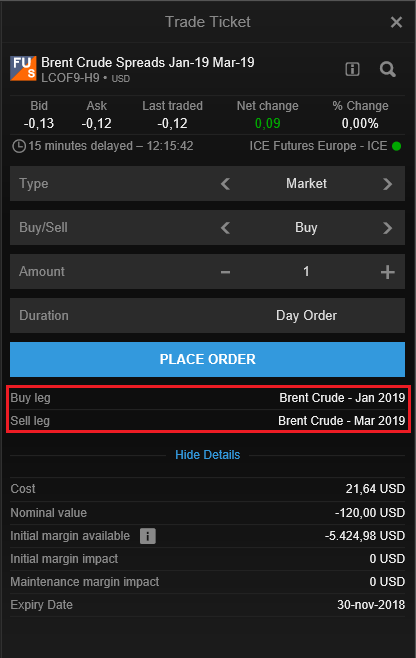
Read about Futures Trading Conditions on our web page.
Warning, when trading having sub-accounts
In G&T Trader and G&T TraderPro, we display a yellow warning if you are about to place a trade in an instrument denominated in a currency, different from the currency of the account AND you have an account available in the same currency as the instrument you are trading. The warning is informative only and will not prevent you from placing a trade.
In the below image the selected instrument is Apple Inc., but the selected account is in SGD.
If client decides to buy the Apple stock from his SGD account, system converts a necessary amount of SGD to USD and purchase a stock. Please, be aware, that a currency conversion fee applies in such case.
How do I change settings on G&T Trader?
Click on the Settings icon in the top right corner and you will be able to customize the following settings:
How do I subscribe to live prices?
You can subscribe to Live Prices via the trading platform.
Delayed prices are shown free-of-charge for all exchange-traded instruments such as Stocks, Options, Stock CFDs, Futures and Bonds. The icon  on the trade ticket or instrument overview indicates you have delayed prices.
Live prices require a paid subscription to the exchanges you want to receive live prices from and are denoted with a live icon
The subscription fees will be debited from your account on a monthly basis.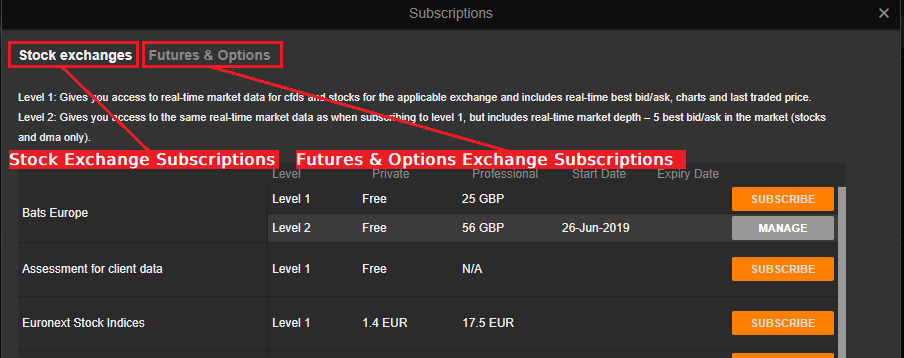
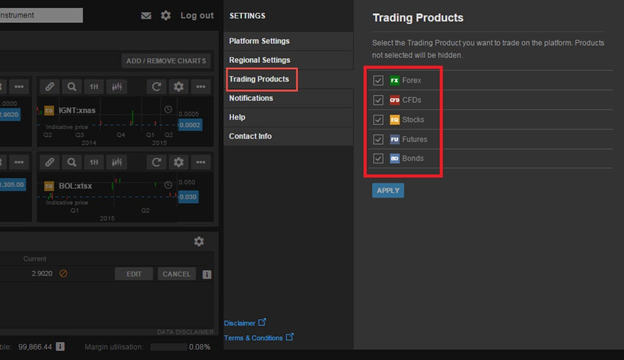
Why am I not able to see all instruments on G&T Trader?
The first time you logged into G&T Trader you were prompted to select the products you wanted to trade on the platform. The reason you can't see some products is probably because you didn't click all the products.
It's easy to add the missing products, just go to Settings >> Trading Products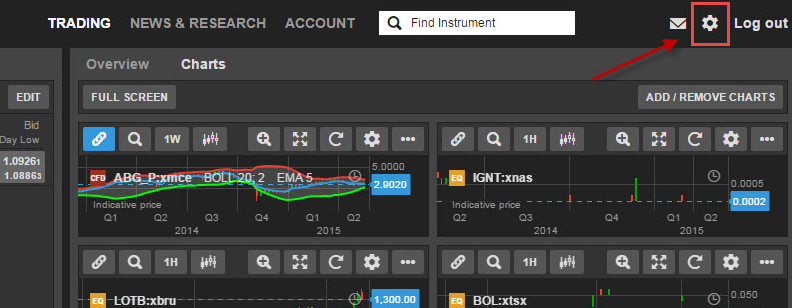
I can't find my related orders in my "Orders" view of G&T Trader
You can manage rules for what should be visible in the Orders view by going to Settings >> Platform Settings >> Display rules for orders list.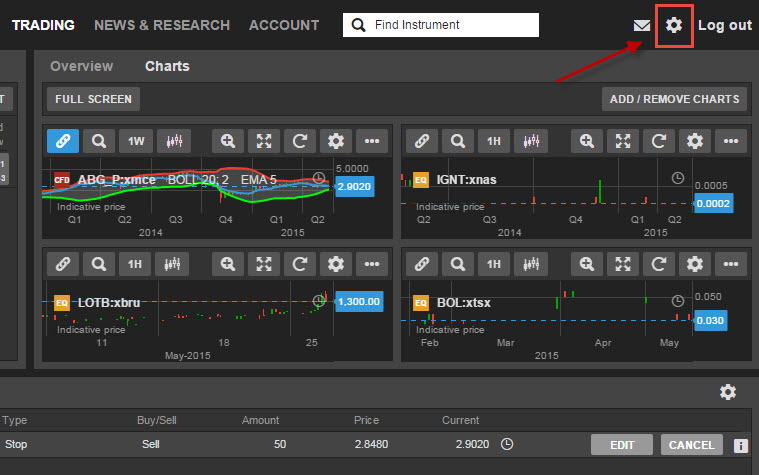
"Chart is not available for this instrument"
If the chart is not showing data and with the message "Chart is not available for this instrument", this is probably because you do not have a subscription to the exchange of the instrument you have selected.
Please see example: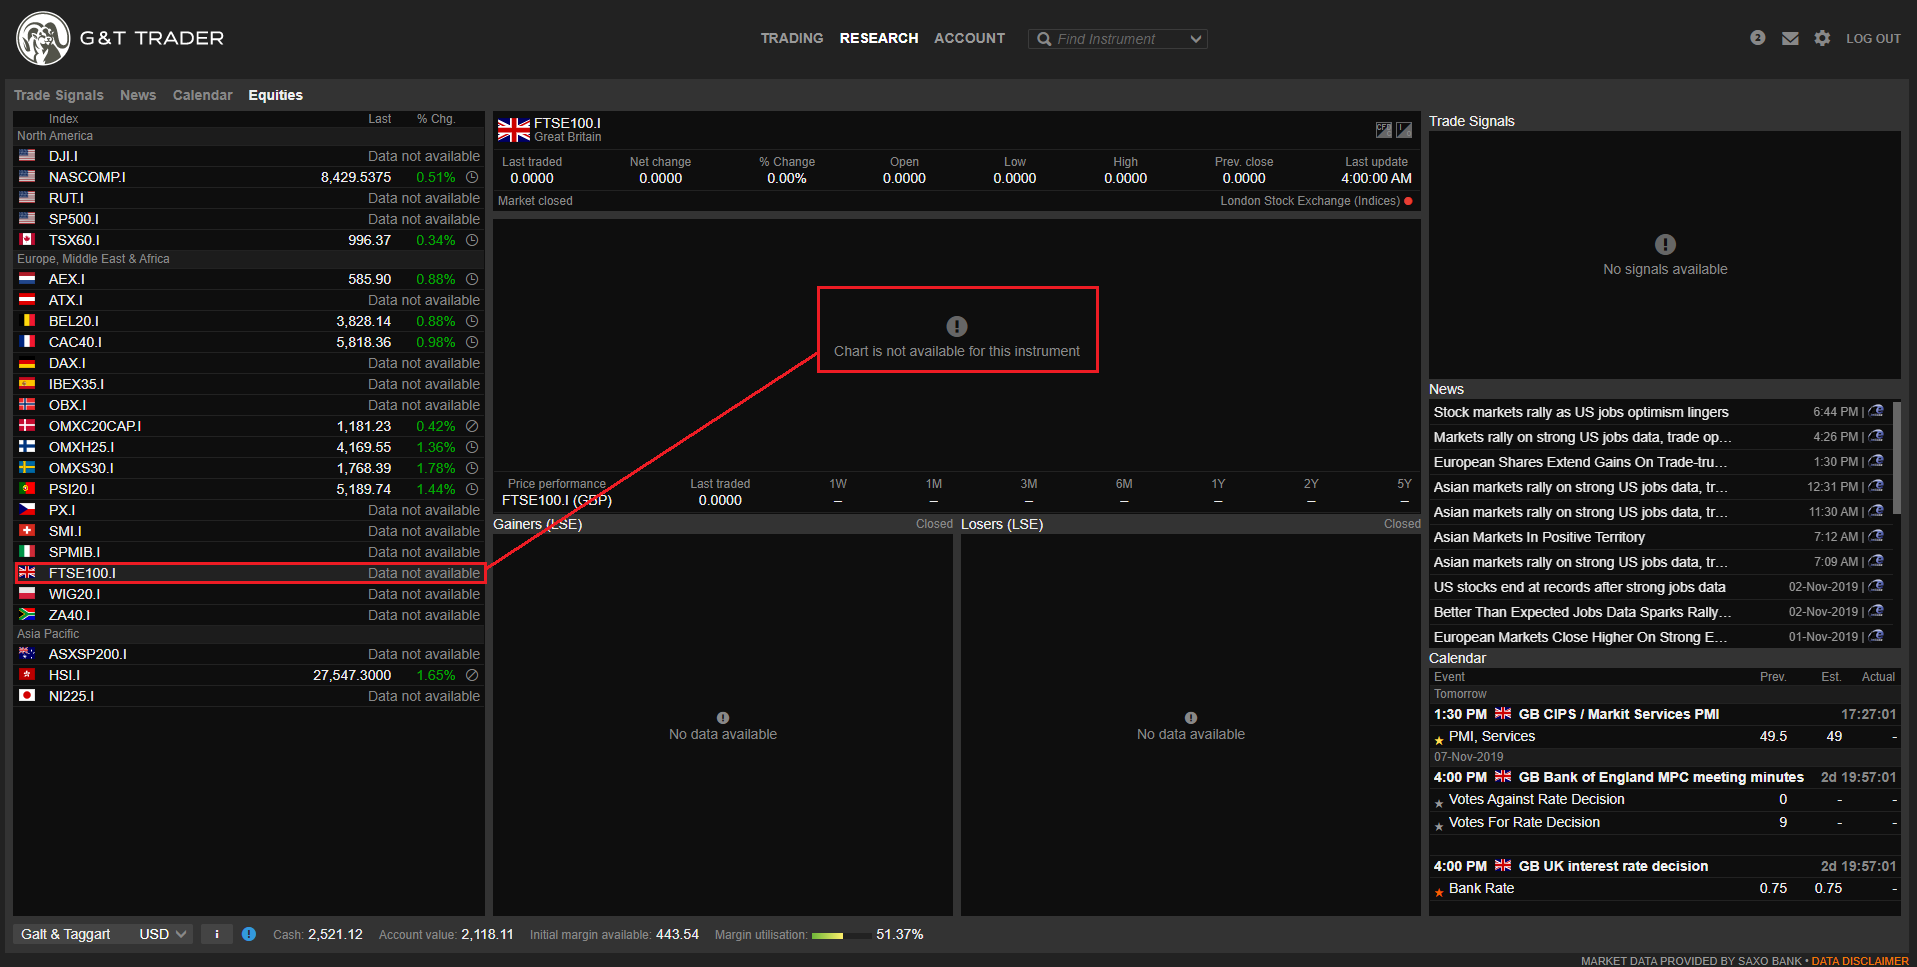
Request an account opening online via our website
Add funds quickly and securely via bank transfers
Access 35,000+ instruments across all asset classes

All platforms are available from single G&T account.
Request an account opening online via our website
Add funds quickly and securely via bank transfers
Access 35,000+ instruments across all asset classes


